Complete Blacklist
Briana Mittleman
2018-03-02
Last updated: 2018-03-10
Code version: fdba2be
This analysis will allow me assess the places in the data that account for the read pileup. I will look for ribosomal, snoRNA, snRNA, hNRP genes. I will then look at highly expressed genes that we would not expect high expression/pileup such as insig1 (found in net3 exploration). I will remove reads at all of these locations by creating a blacklist of sequences to filter the fastq files.
Gene expression analysis
Insig2
First I am subsetting the genome coverage file for the 2nd chromosome. This is where insig2 is. I can use this to look at the distribution.
awk '{ if ($1 = 2) { print } }' YG-SP-NET3-18486_combined_Netpilot-sort.dedup.cov.bed  > YG-SP-NET3-18486_combined_Netpilot-sort.dedup.cov.chr2.bed


awk '{ if ($1 = 2) { print } }' YG-SP-NET3-18486_combined_Netpilot-sort.cov.bed  > YG-SP-NET3-18486_combined_Netpilot-sort.cov.chr2.bed

awk '{ if ($2 > 118846028 && $2 < 118868573) { print }}' YG-SP-NET3-18486_combined_Netpilot-sort.cov.chr2.bed >  YG-SP-NET3-18486_combined_Netpilot-sort.cov.insig2.bed
Pull in the insig2:
insig2=read.table("../data/YG-SP-NET3-18486_combined_Netpilot-sort.cov.insig2.bed", header=FALSE)
plot(insig2$V3 ~ insig2$V2, ylab="Read count", xlab="Chrom 2 position", main="Genome Coverage at Ingsig2 gene")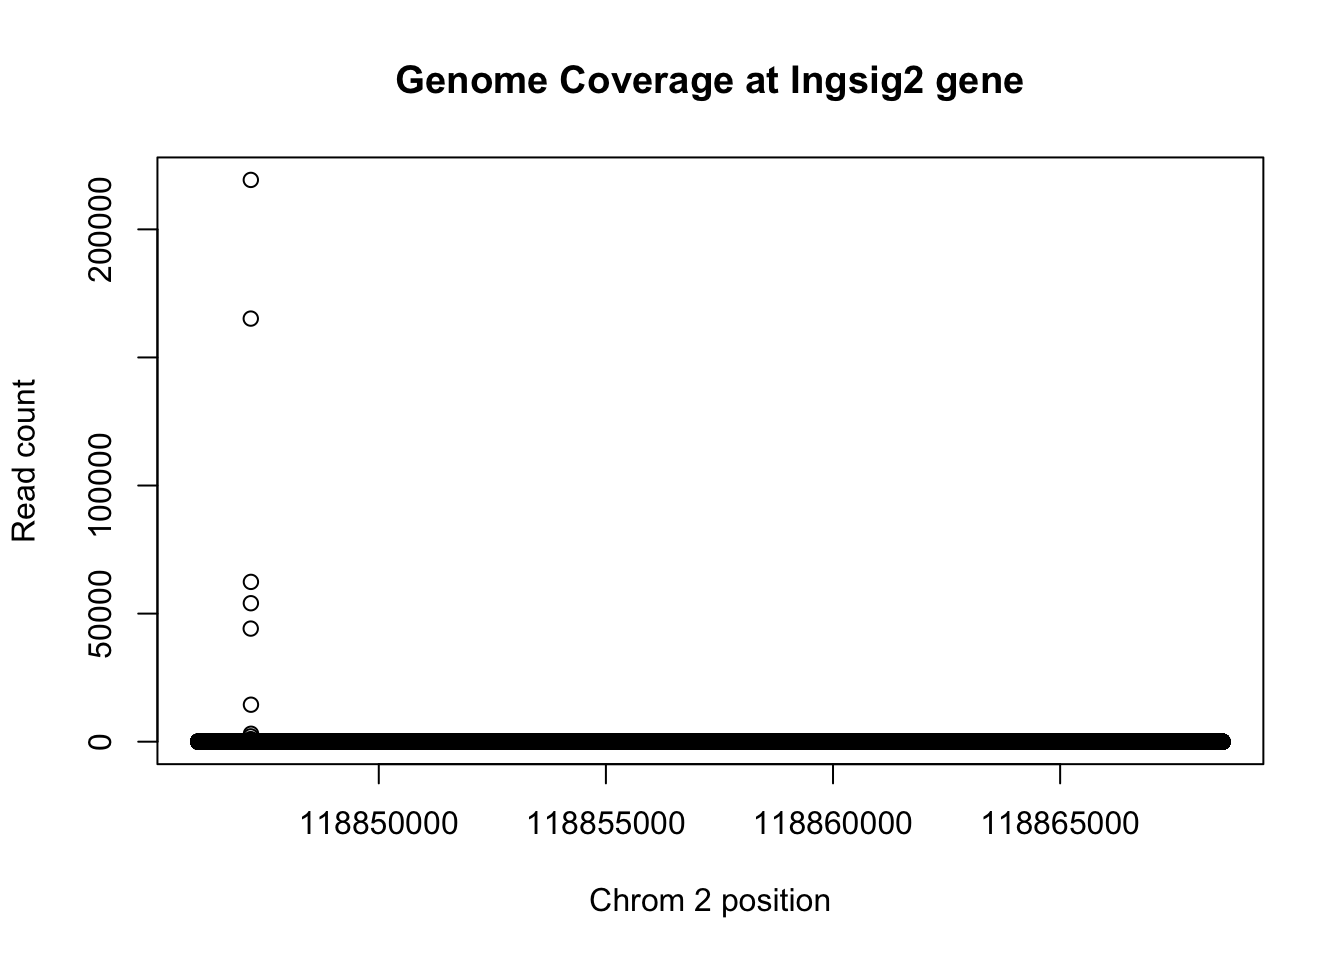
Do this for the same line but deduplicated:
awk '{ if ($2 > 118846028 && $2 < 118868573) { print }}' YG-SP-NET3-18486_combined_Netpilot-sort.dedup.cov.chr2.bed > YG-SP-NET3-18486_combined_Netpilot-sort.dedup.cov.insig2.bed
insig2_de=read.table("../data/YG-SP-NET3-18486_combined_Netpilot-sort.dedup.cov.insig2.bed", header=FALSE)
plot(insig2_de$V3 ~ insig2_de$V2, ylab="Molecule count", xlab="Chrom 2 position", main="Genome Coverage at Ingsig2 gene (deduplicated)")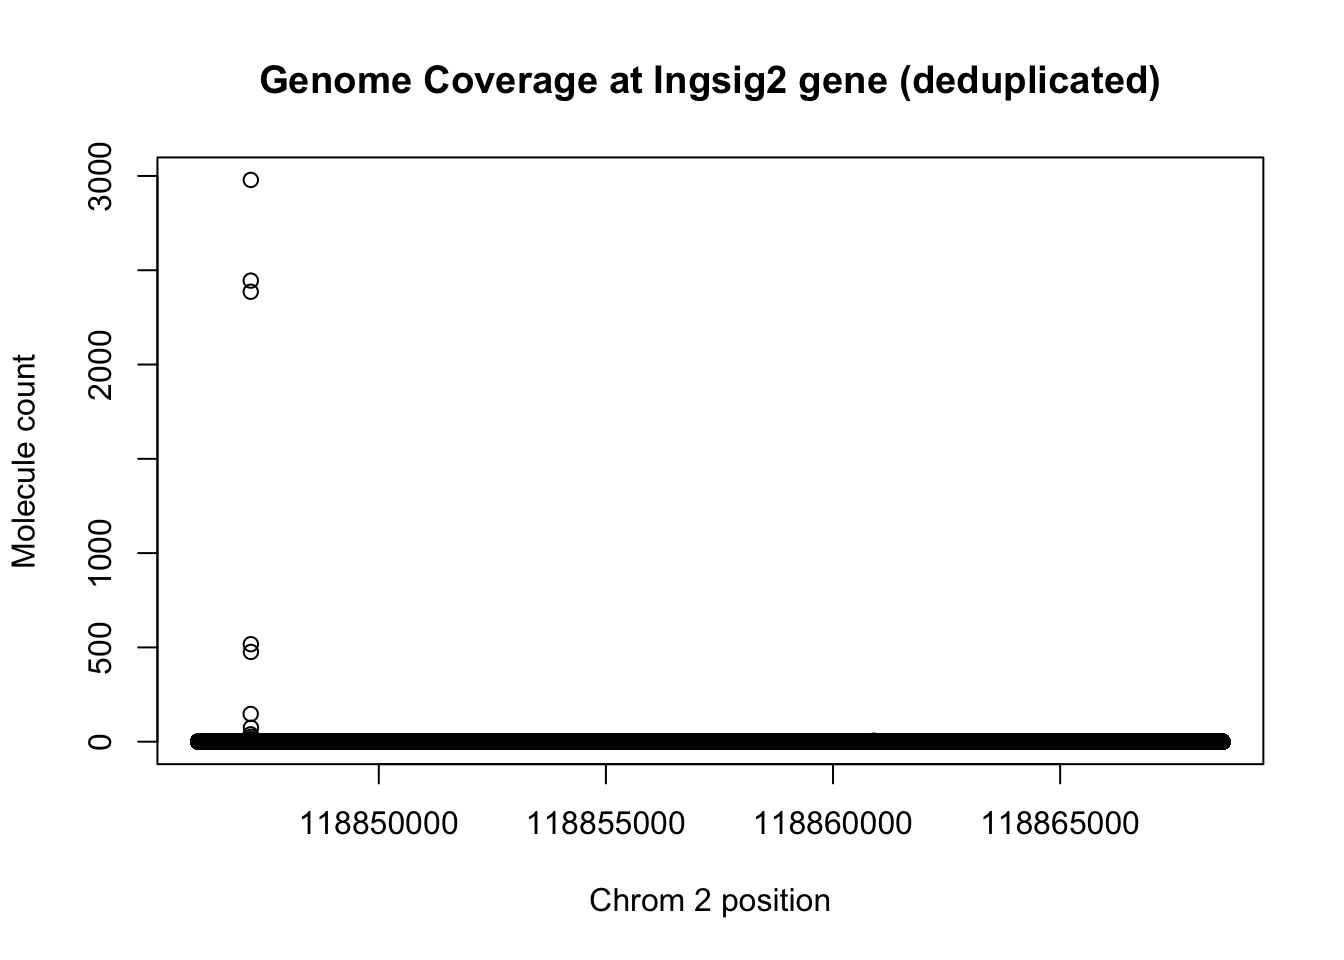
max_sort=max(insig2$V3)
max_sort_de=max(insig2_de$V3)
1- max_sort_de/max_sort
[1] 0.9864162This means that the deduplication removed 99 percent of the buildup but the peak is still there.
Try this with ggplot.
library(ggplot2)
colnames(insig2)=c("chr", "pos", "count")
denstiy_plot= ggplot(data=insig2, aes(y=count, x=pos)) + geom_line(aes(x=pos,y=count))
denstiy_plot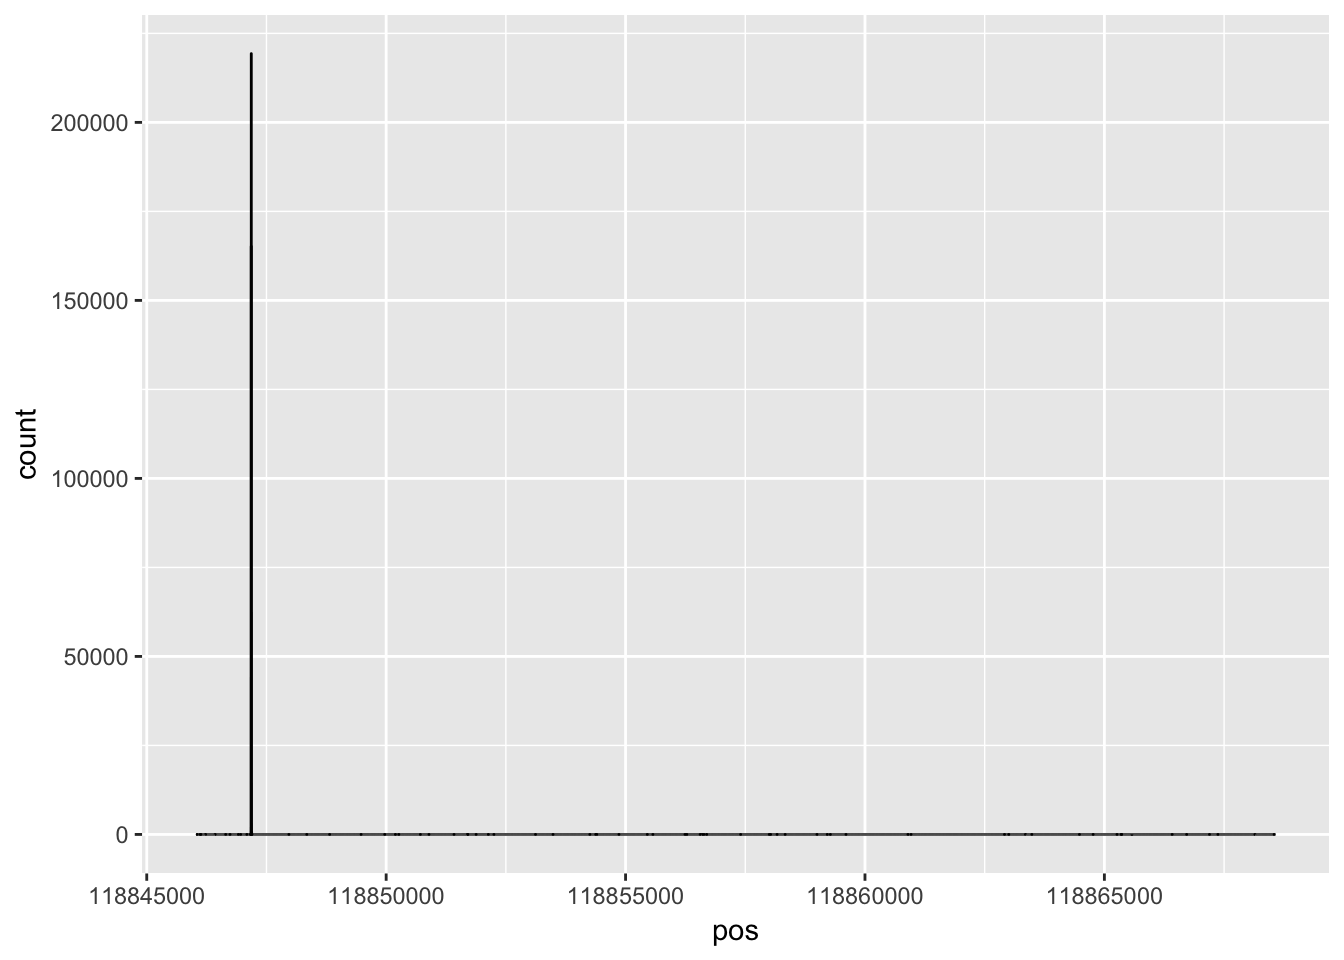
Expand to more genes
How to make this more efficent:
* Look at the top genes
* create a script where I can enter the positions and get out the gene coverage by base (need gene name, chrom, start, end) * pull it into R and plot like this
To do this I need to use bedtools coverage -counts
Copy the gencode gene file /project2/gilad/briana/Net-seq/Net-seq3/gencode_noCHR_genes_MT_Fsort.bed to genome annotation.
#!/bin/bash

#SBATCH --job-name=count_cov
#SBATCH --output=count_cov_sbatch.out
#SBATCH --error=count_cov_sbatch.err
#SBATCH --time=8:00:00
#SBATCH --partition=broadwl
#SBATCH --mem=36G
#SBATCH --mail-type=END

module load Anaconda3

source activate net-seq


sample=$1

describer=$(echo ${sample} | sed -e 's/.*\YG-SP-//' | sed -e "s/_combined_Netpilot-sort.bed$//")

bedtools coverage -counts -sorted -a /project2/gilad/briana/genome_anotation_data/gencode_noCHR_genes_MT_Fsort.bed -b $1 > /project2/gilad/briana/Net-seq-pilot/data/gene_cov/${describer}.gene.coverage.bed
Run this first for /project2/gilad/briana/Net-seq-pilot/data/gene_cov/YG-SP-NET3-18486_combined_Netpilot-sort.bed
gene_cov_18486= read.table("../data/NET3-18486.gene.coverage.bed")
colnames(gene_cov_18486)= c("chr", "start", "end", "gene", "score", "strand", "count")
summary(gene_cov_18486$count) Min. 1st Qu. Median Mean 3rd Qu. Max.
0 0 14 1665 65 31156619 gene_cov_18486_sort= gene_cov_18486[order(gene_cov_18486$count, decreasing = TRUE),]
plot(log10(gene_cov_18486_sort$count))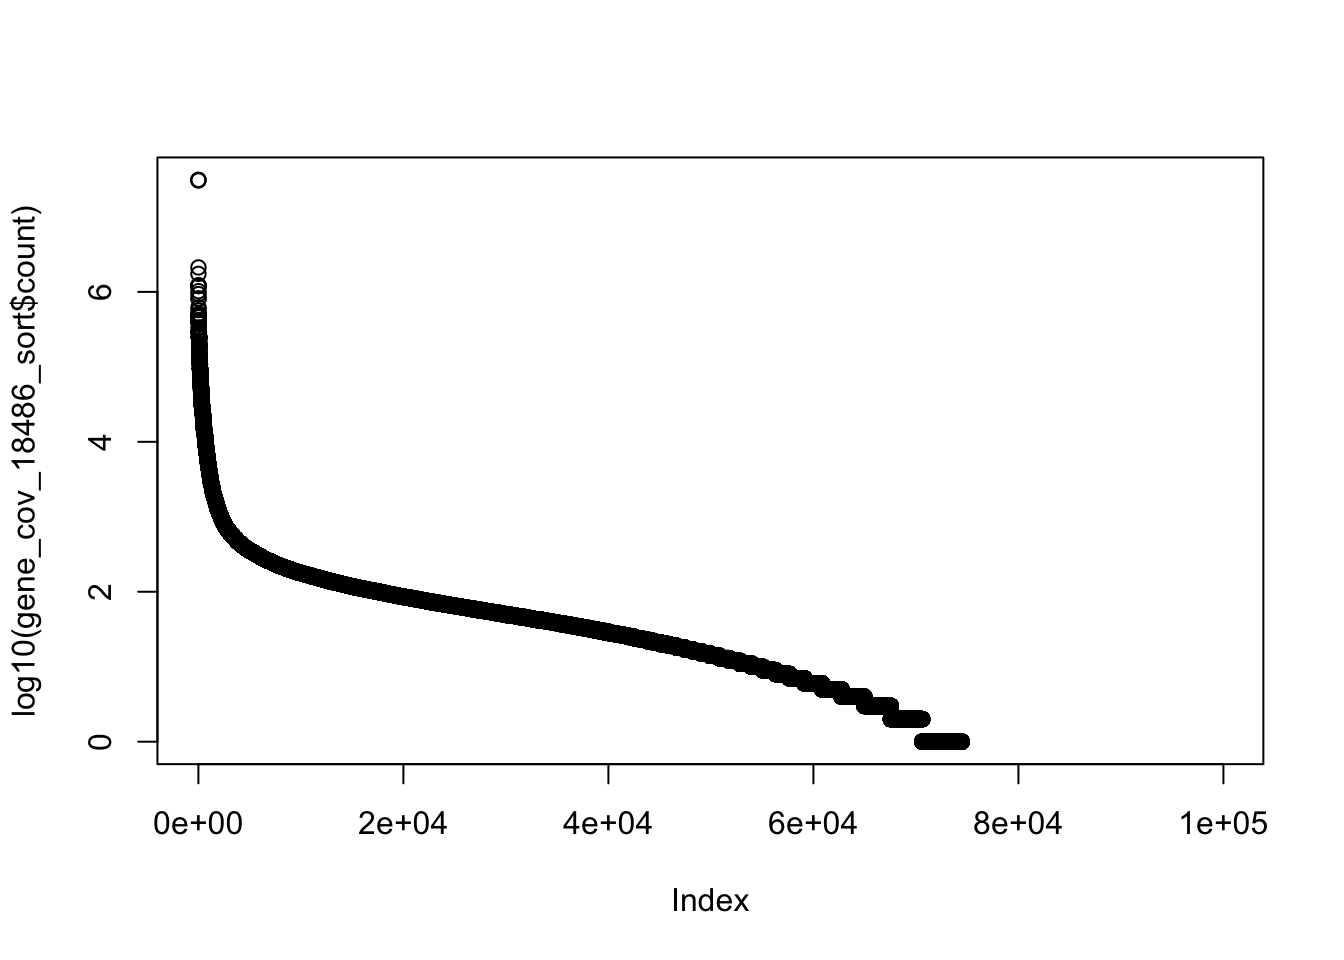
gene_cov_18486_sort[1:15,] chr start end gene score strand count
12688 2 118846049 118867604 ENST00000245787.4 0 + 31156619
12689 2 118846049 118868573 ENST00000485520.1 0 + 31156619
12690 2 118889703 118943962 ENST00000414886.1 0 - 30589292
5265 1 148604907 148605072 ENST00000384476.1 0 - 2118514
71571 15 65597014 65597130 ENST00000363286.1 0 + 1738588
71568 15 65558914 65592956 ENST00000558873.1 0 - 1220341
71570 15 65588388 65588504 ENST00000362698.1 0 + 1219665
52960 10 103113819 103317078 ENST00000370187.3 0 + 1198878
52961 10 103113858 103317054 ENST00000393441.4 0 + 1198862
52962 10 103113863 103317078 ENST00000408038.2 0 + 1198862
52963 10 103124601 103124792 ENST00000410482.1 0 - 1198755
5276 1 149224057 149224221 ENST00000384010.1 0 - 1022753
23151 4 76781024 76823681 ENST00000286719.7 0 - 935122
56403 11 62600383 62609281 ENST00000525239.1 0 - 813933
56407 11 62609090 62609281 ENST00000410396.1 0 - 813798Many of these are SnRNAs. Getting rid of these should help.
- Insig2
- (lincRNA)- AC093901.1- CCAGGGAA(+) so - strand is GGTCCCTT
- RNU5B (SnRNA) ENST00000363286.1
- RNVU1 (SnRNA)
- RNU5A (SnRNA)
- BTRC
Make the bash script
#!/bin/bash

#SBATCH --job-name=gene_cov
#SBATCH --time=8:00:00
#SBATCH --output=gene_cov_sbatch.out
#SBATCH --error=gene_cov_sbatch.err
#SBATCH --partition=broadwl
#SBATCH --mem=10G
#SBATCH --mail-type=END

#script takes in the chr, start, end, and gene name. It will output a
chr=$1
start=$2
end=$3
name=$4


awk -v var=${chr} '{ if ($1 = var) { print }}' /project2/gilad/briana/Net-seq-pilot/data/cov/YG-SP-NET3-18486_combined_Netpilot-sort.cov.bed  > temp

awk -v var1=${start} -v var2=${end} '{ if ($2 > var1 && $2 < var2) { print }}' -v var1=${start} -v var2=${end} temp >  /project2/gilad/briana/Net-seq-pilot/output/high_gene_cov/YG-SP-NET3-18486_combined_Netpilot-sort.cov.${name}.bed
Rfunction to make plot:
plot_gene_dis <- function(file, chr, geneName){
  gene <- read.table(file, header=FALSE)
  colnames(gene)=c("chr", "pos", "count")
  plt_gene = ggplot(data=gene) + geom_line(aes(x=pos,y=count)) + ggtitle(paste("Genome coverage at ",geneName)) + xlab(paste("Chrom ",chr ," postion")) + ylab("read count")
  return(plt_gene)
}
sbatch high_ex_gene_cov.sh ‘1’ ‘148604907’ ‘148605072’ ‘AC093901’
aco_plt=plot_gene_dis("../data/YG-SP-NET3-18486_combined_Netpilot-sort.cov.AC093901.bed", "1", "ACO93901")
aco_plt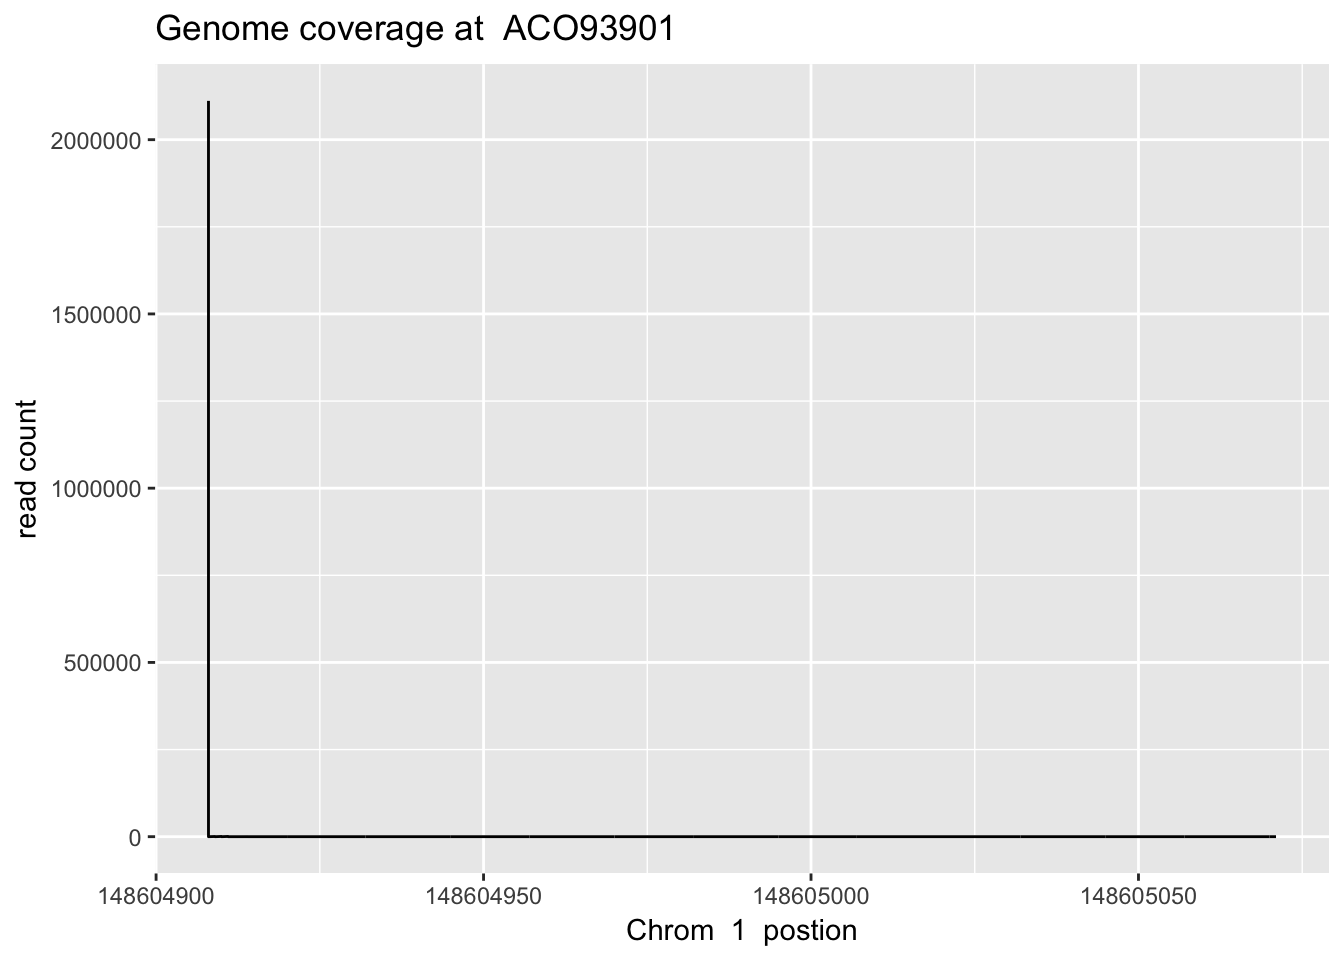
sbatch high_ex_gene_cov.sh ‘15’ ‘65597014’ ‘65597130’ ‘RNU5B’
RNU5B_plt=plot_gene_dis("../data/YG-SP-NET3-18486_combined_Netpilot-sort.cov.RNU5B.bed", "15", "RNU5B")

RNU5B_plt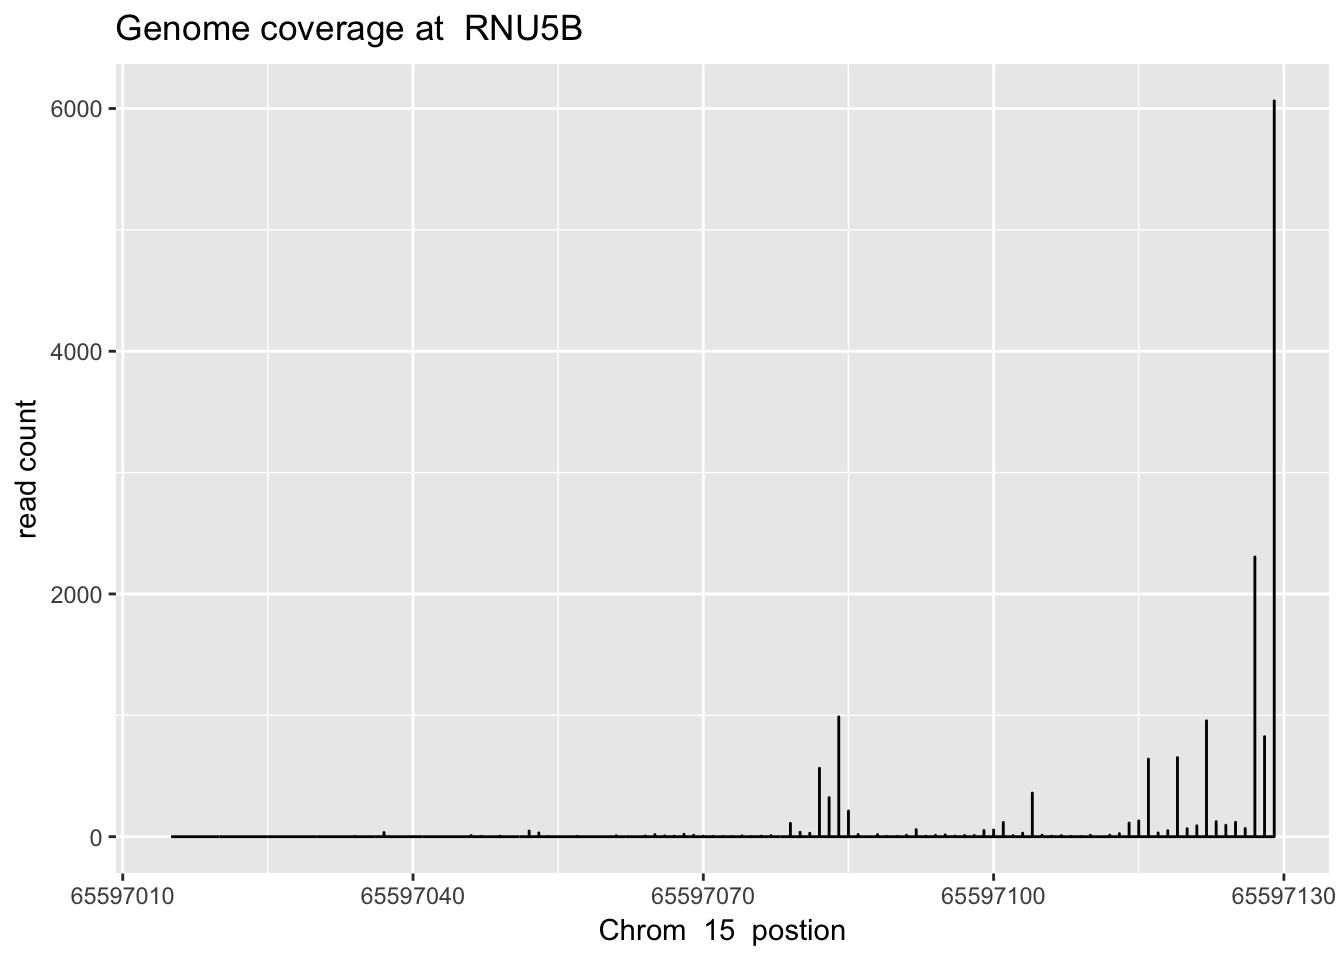
RNU5B=read.table("../data/YG-SP-NET3-18486_combined_Netpilot-sort.cov.RNU5B.bed", header=FALSE, col.names = c("chr", "pos", "count"))sbatch high_ex_gene_cov.sh ‘10’ ‘103113819’ ‘103317078’ ‘BTRC’
btrc_plt= plot_gene_dis("../data/YG-SP-NET3-18486_combined_Netpilot-sort.cov.BTRC.bed", "10", "BTRC")
btrc_plt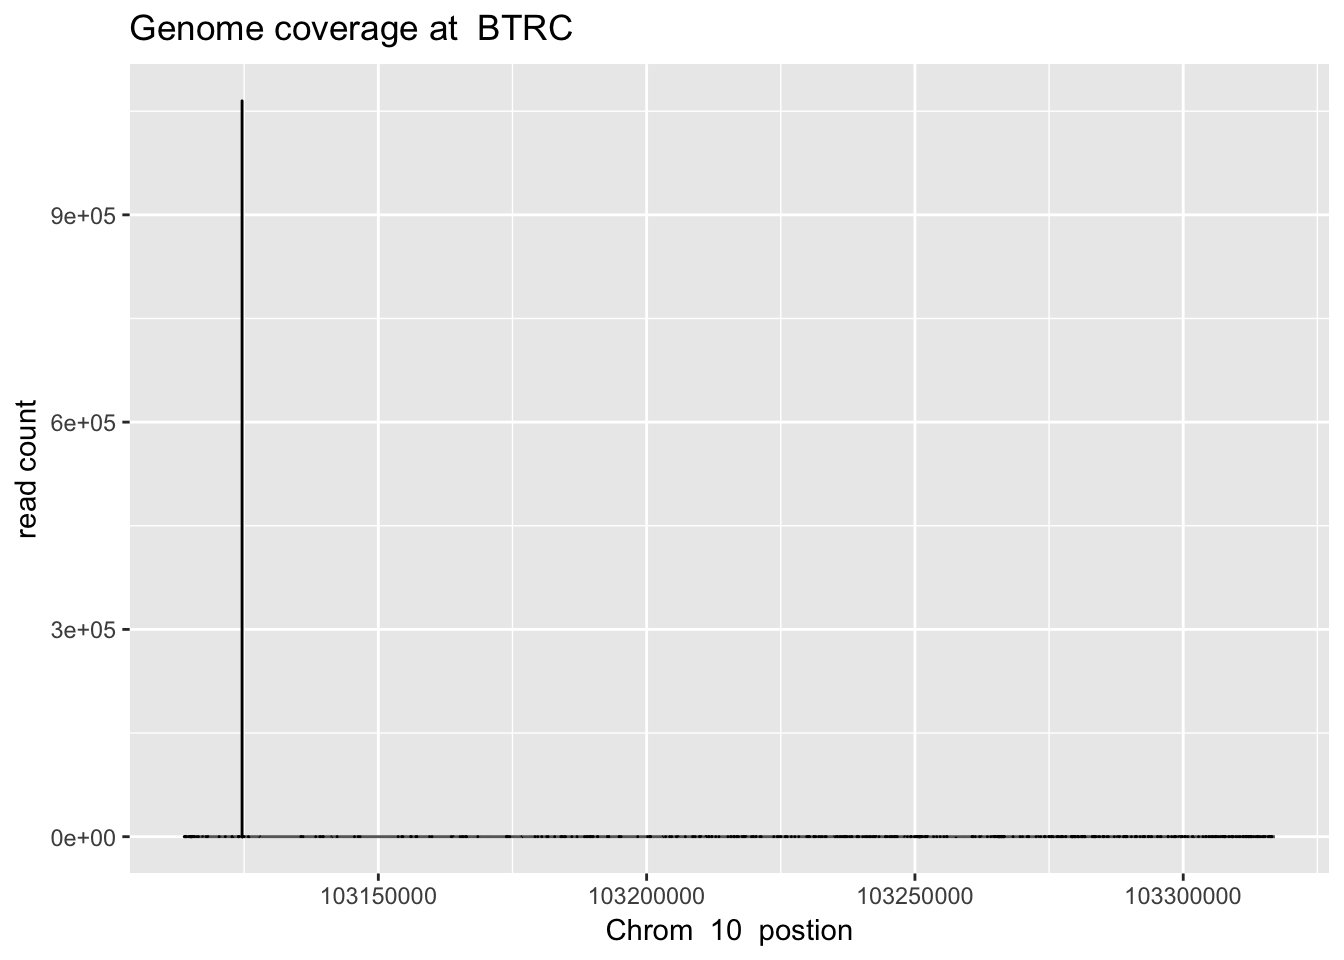
btrc=read.table("../data/YG-SP-NET3-18486_combined_Netpilot-sort.cov.BTRC.bed", header=FALSE)
colnames(btrc)= c("chr", "pos", "count")
plot(btrc$count~btrc$pos)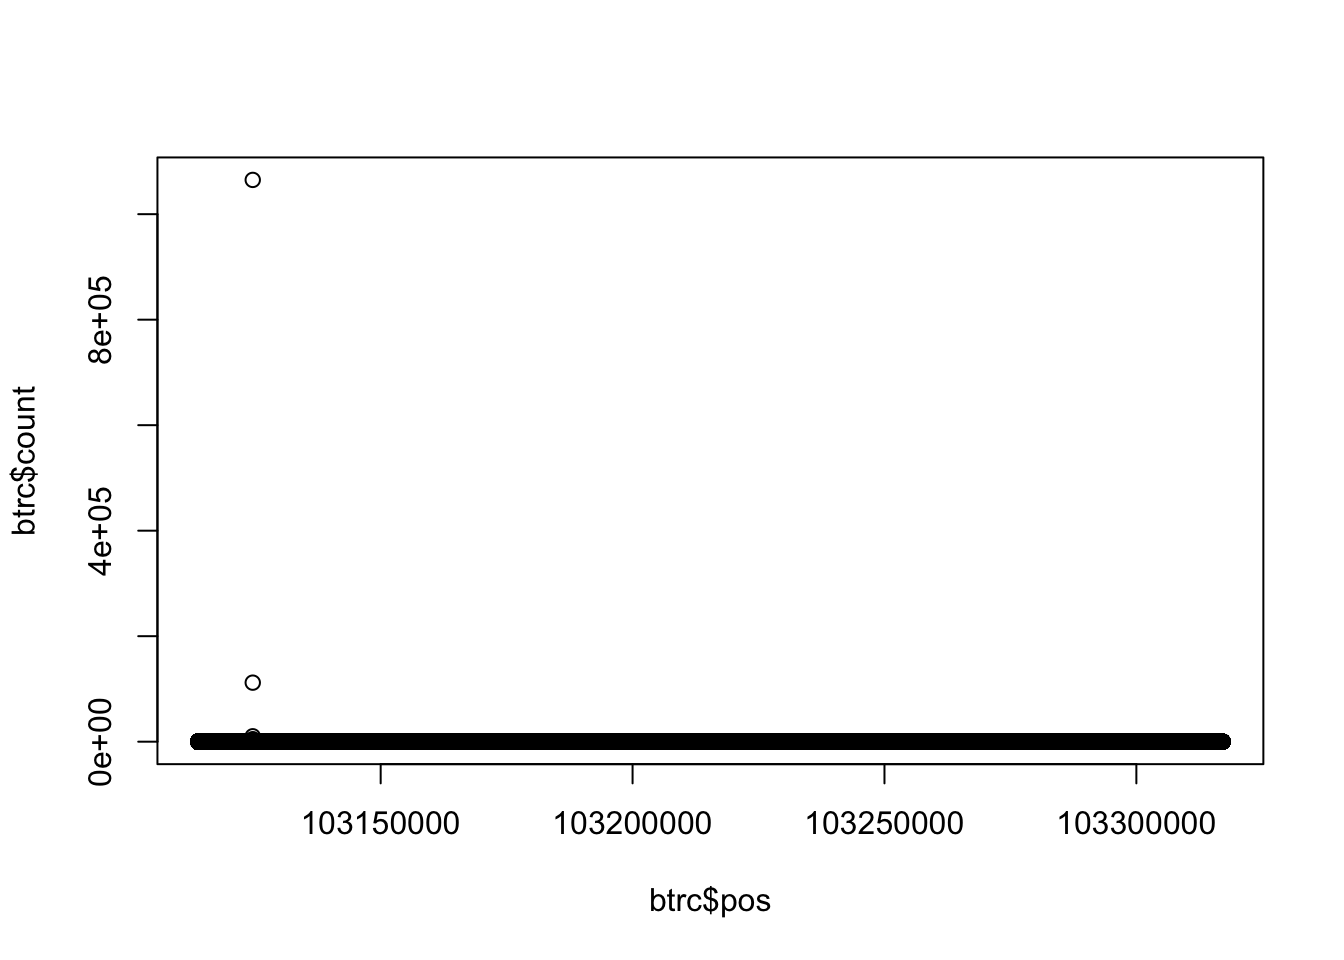
btrc_sort=btrc[order(btrc$count, decreasing=TRUE),]
btrc_sort[1:20,]
chr pos count
1840110 10 103124607 1064950
1840111 10 103124608 111925
1840108 10 103124605 10272
1840112 10 103124609 4733
1840109 10 103124606 1846
1840113 10 103124610 1693
1840114 10 103124611 967
1840115 10 103124612 835
1840116 10 103124613 698
1840254 10 103124751 114
1840117 10 103124614 79
1840159 10 103124656 78
1840165 10 103124662 77
1840158 10 103124655 72
1809410 10 103297165 56
841530 10 103142317 49
1840154 10 103124651 47
1610687 10 103301700 39
1840157 10 103124654 32
1840152 10 103124649 30sbatch high_ex_gene_cov.sh ‘10’ ‘103124601’ ‘103124792’ ‘rnu259p’
rnu259_plt=plot_gene_dis("../data/YG-SP-NET3-18486_combined_Netpilot-sort.cov.rnu259p.bed", "10", "rnu259p")
rnu259_plt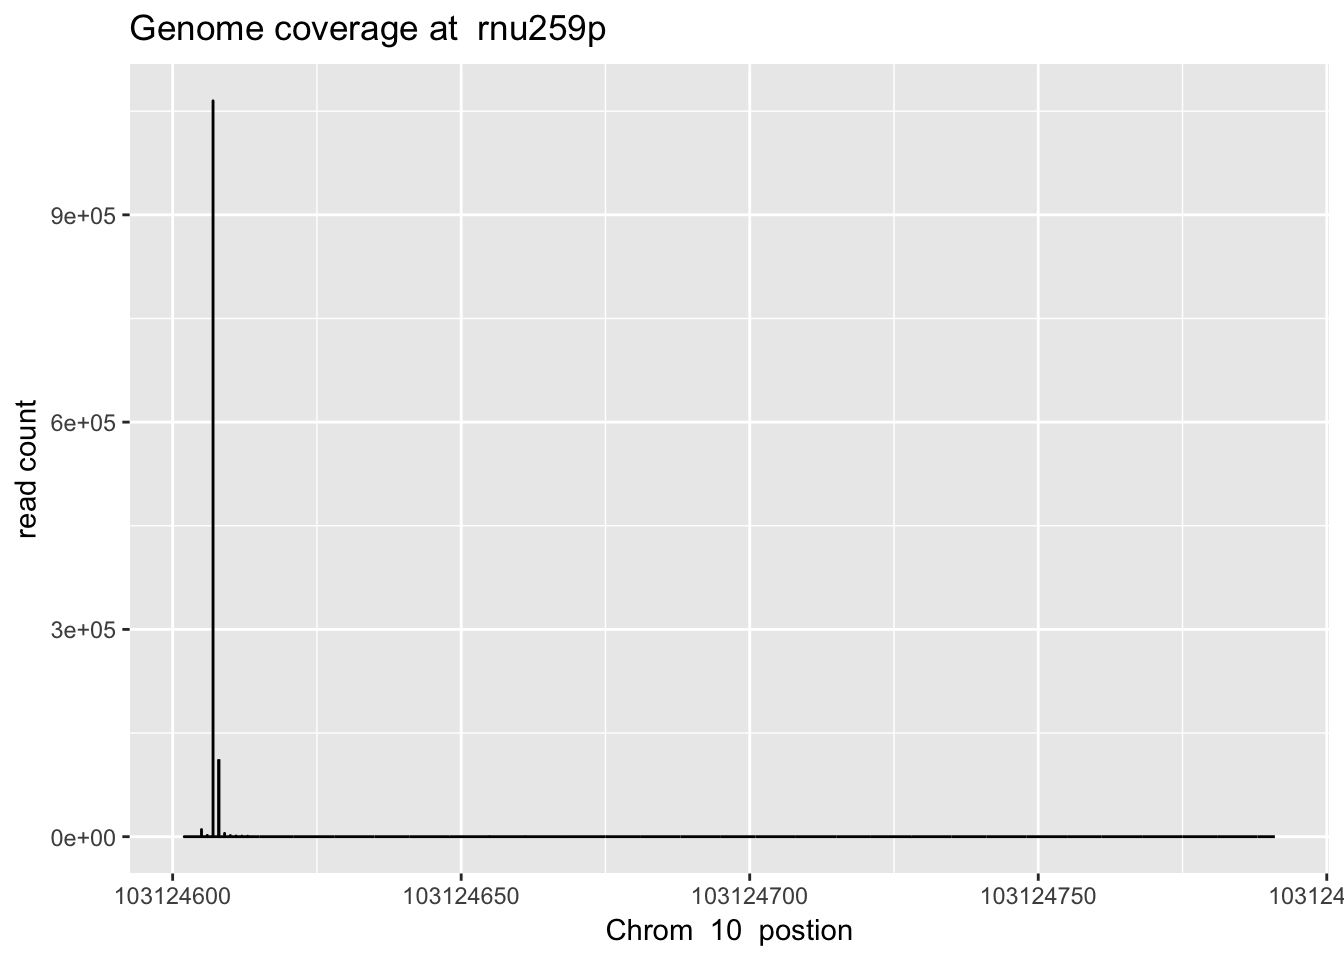
sbatch high_ex_gene_cov.sh ‘4’ ‘76781024’ ‘76823681’ ‘ppef2’
ppef2_plt= plot_gene_dis("../data/YG-SP-NET3-18486_combined_Netpilot-sort.cov.ppef2.bed", "4", "ppef2")
ppef2_plt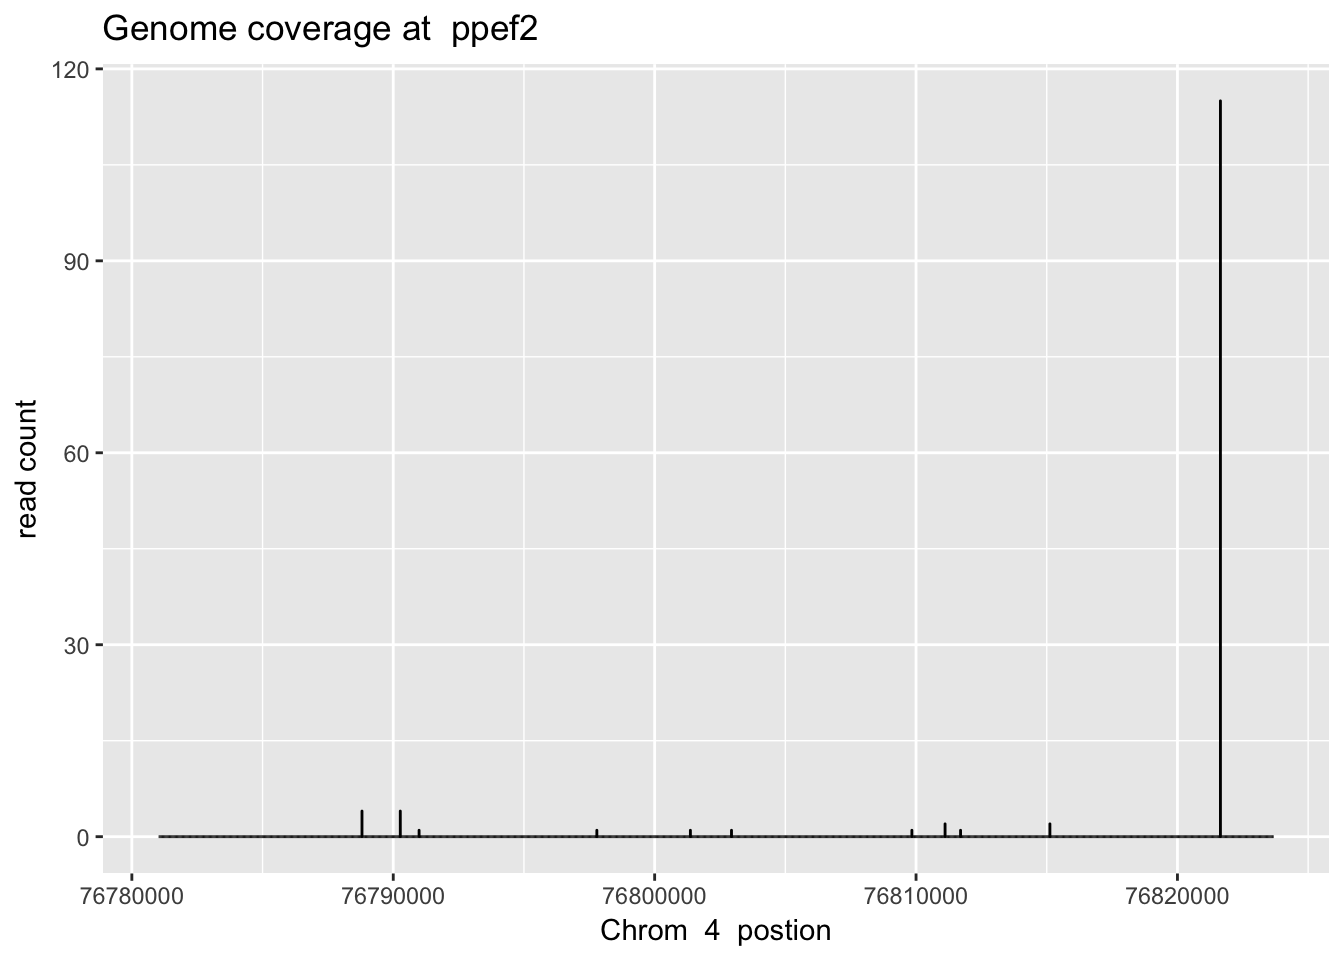
sbatch high_ex_gene_cov.sh ‘11’ ‘62600383’ ‘62609281’ ‘WDR74’ 62600383 62609281
WDR74_plt= plot_gene_dis("../data/YG-SP-NET3-18486_combined_Netpilot-sort.cov.WDR74.bed", "11", "WDR74")
WDR74_plt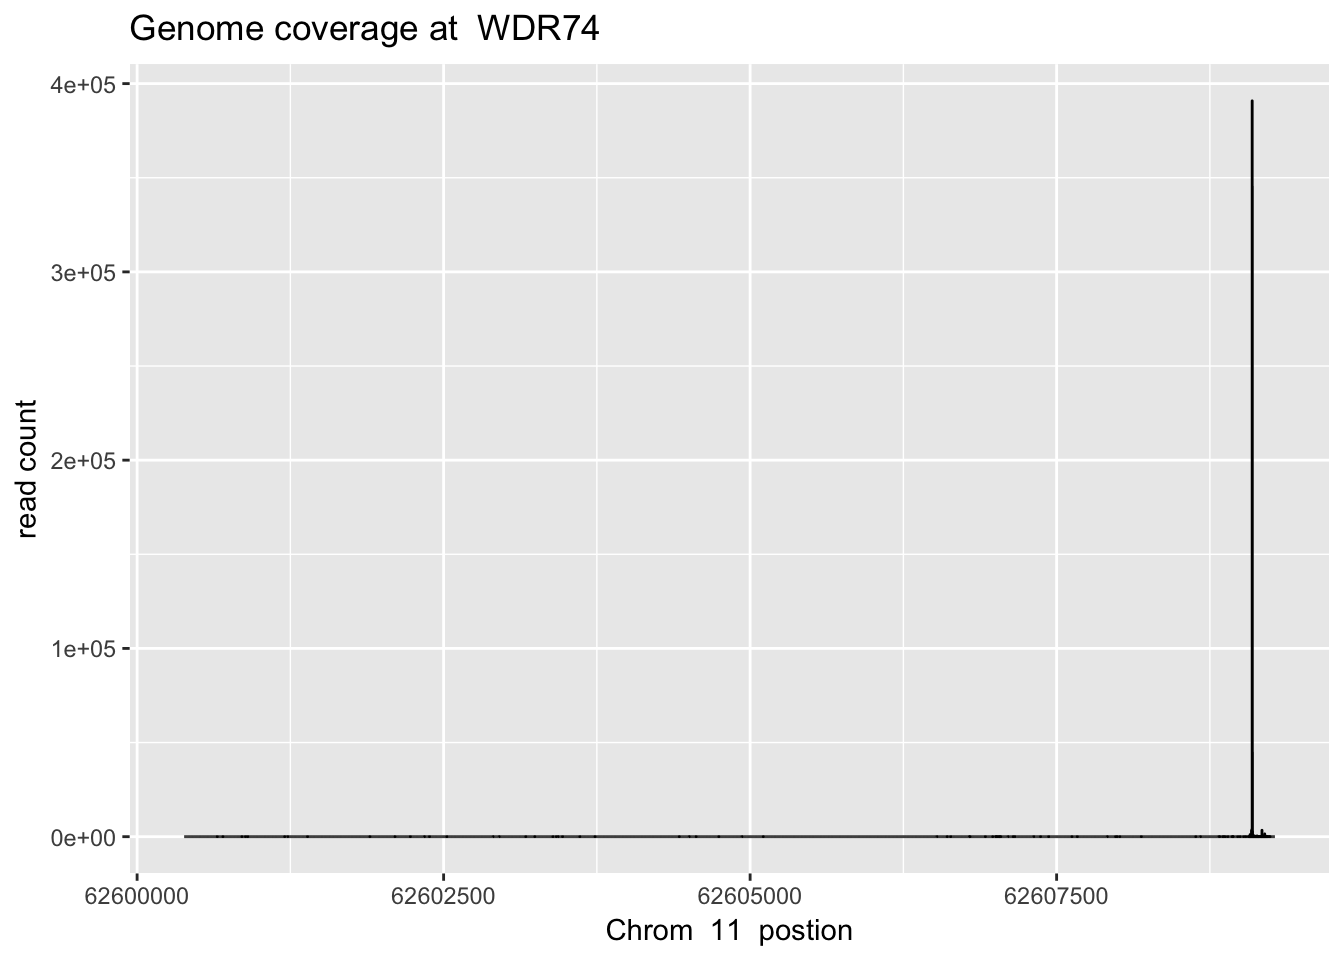
wd74=read.table("../data/YG-SP-NET3-18486_combined_Netpilot-sort.cov.WDR74.bed")
colnames(wd74)=c("chr", "pos", "count")
summary(wd74$V3)
Length Class Mode
0 NULL NULL Summary stat for buildup
Think for a summary statistic for these genes. Maybe the top position over the sum of the gene standardized by length?
buildup_test_stat=function(df){
  length=nrow(df)
  x=df$count/length
  max=max(x)
  teststat= max/sum(x)
  return(teststat)
}


buildup_test_stat(insig2)
[1] 0.3864875buildup_test_stat(btrc)[1] 0.8870532buildup_test_stat(RNU5B)[1] 0.3864984buildup_test_stat(wd74)[1] 0.4801532Extend to second sample
Extend analysis to 1 more line to make sure the top genes are the same:
gene_cov_18505= read.table("../data/NET3-18505.gene.coverage.bed")
colnames(gene_cov_18505)= c("chr", "start", "end", "gene", "score", "strand", "count")
summary(gene_cov_18505$count) Min. 1st Qu. Median Mean 3rd Qu. Max.
0 0 17 1290 76 17872558 gene_cov_18505_sort= gene_cov_18505[order(gene_cov_18505$count, decreasing = TRUE),]
plot(log10(gene_cov_18505_sort$count))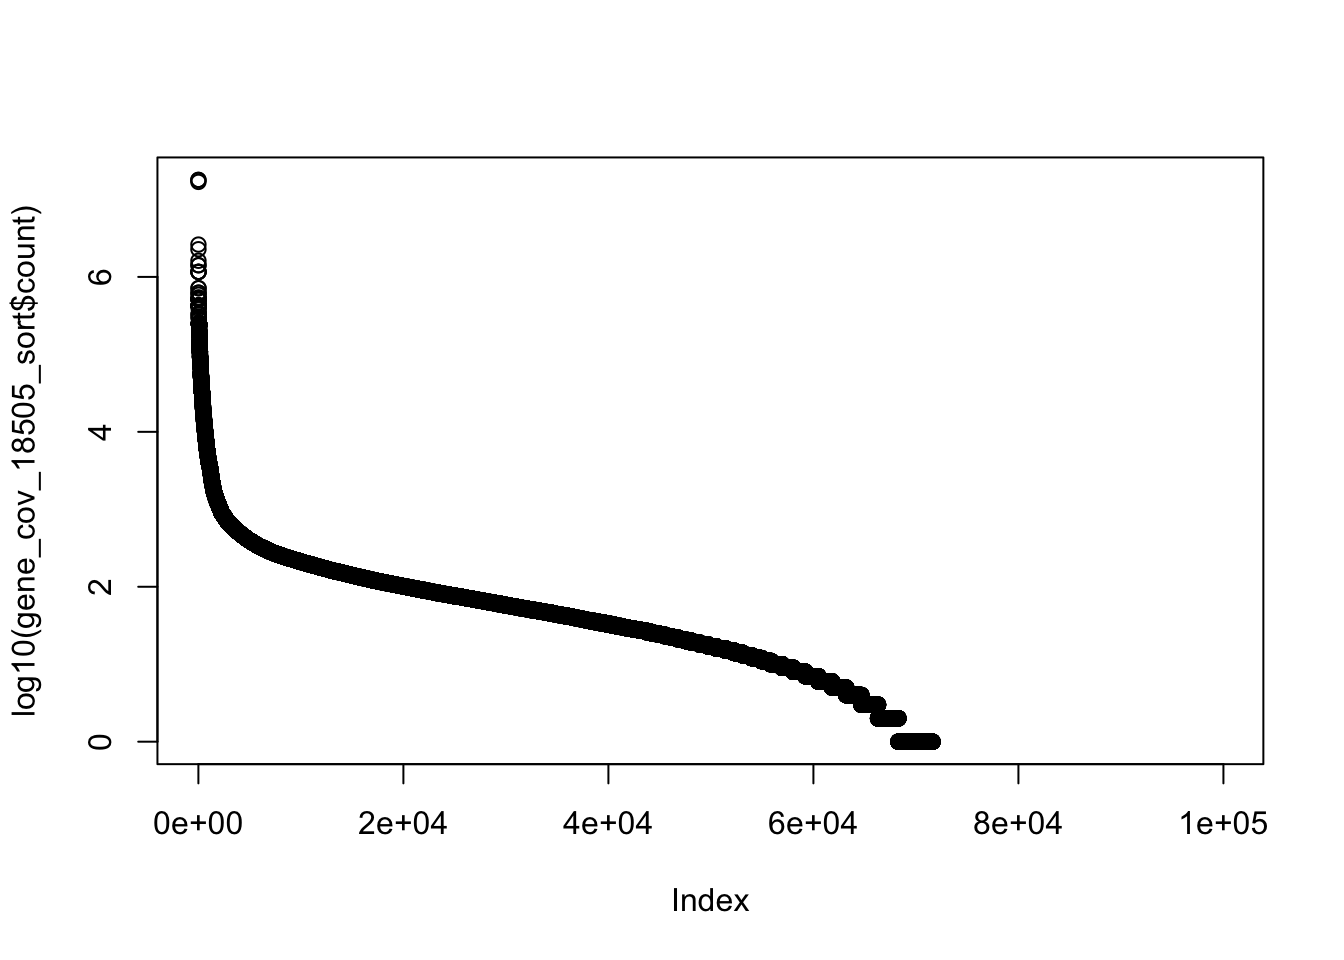
gene_cov_18505_sort[1:15,] chr start end gene score strand count
12688 2 118846049 118867604 ENST00000245787.4 0 + 17872558
12689 2 118846049 118868573 ENST00000485520.1 0 + 17872558
12690 2 118889703 118943962 ENST00000414886.1 0 - 16850121
5265 1 148604907 148605072 ENST00000384476.1 0 - 2615409
71571 15 65597014 65597130 ENST00000363286.1 0 + 2275911
23151 4 76781024 76823681 ENST00000286719.7 0 - 1616087
71568 15 65558914 65592956 ENST00000558873.1 0 - 1415228
71570 15 65588388 65588504 ENST00000362698.1 0 + 1414560
52960 10 103113819 103317078 ENST00000370187.3 0 + 1161216
52961 10 103113858 103317054 ENST00000393441.4 0 + 1161216
52962 10 103113863 103317078 ENST00000408038.2 0 + 1161216
52963 10 103124601 103124792 ENST00000410482.1 0 - 1161056
56403 11 62600383 62609281 ENST00000525239.1 0 - 714781
56407 11 62609090 62609281 ENST00000410396.1 0 - 714614
88957 19 49990810 49995565 ENST00000391857.4 0 + 626045Compare to RNA seq data:
#!/bin/bash

#SBATCH --job-name=RNA_count_cov
#SBATCH --output=RNA_count_cov_sbatch.out
#SBATCH --error=RNA_count_cov_sbatch.err
#SBATCH --time=8:00:00
#SBATCH --partition=bigmem2
#SBATCH --mem=60G
#SBATCH --mail-type=END

module load Anaconda3

source activate net-seq

bedtools coverage -counts -sorted  -a gencode.Genes.sort.bed -b /project2/gilad/yangili/LCLs/bams/RNAseqGeuvadis_STAR_18486.final.bam > /project2/gilad/briana/Net-seq-pilot/data/RNA_seq_cov/RNAseqGeuvadis_STAR_18486.gene.coverage.bed
Sort the file with bedtools sort -faidx using names.txt in this code directory.
rna_seq=read.table("../data/RNAseqGeuvadis_STAR_18486.gene.coverage.bed", header = FALSE)
rna_seq_genecounts= rna_seq[,1:7]
colnames(rna_seq_genecounts)= c("chr", "start", "end", "gene", "score", "strand", "count")

rna_seq_order=rna_seq_genecounts[order(rna_seq_genecounts$count, decreasing = TRUE),]
plot(log10(rna_seq_order$count))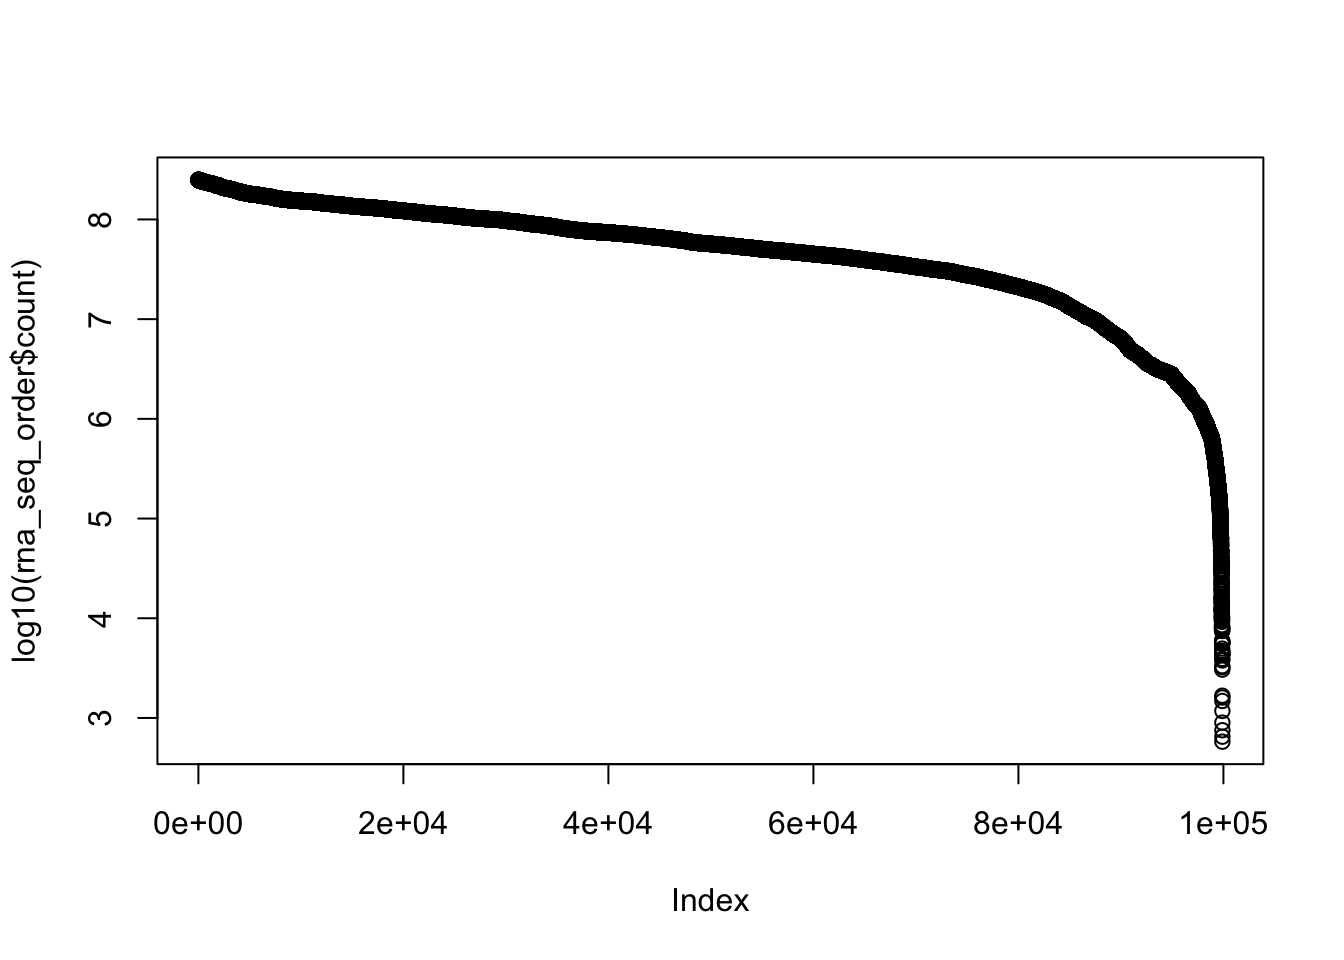
plot(log10(gene_cov_18486_sort$count)) Plot the rank of the genes against each other.
plot(log10(rna_seq_order$count)~log10(gene_cov_18486_sort$count))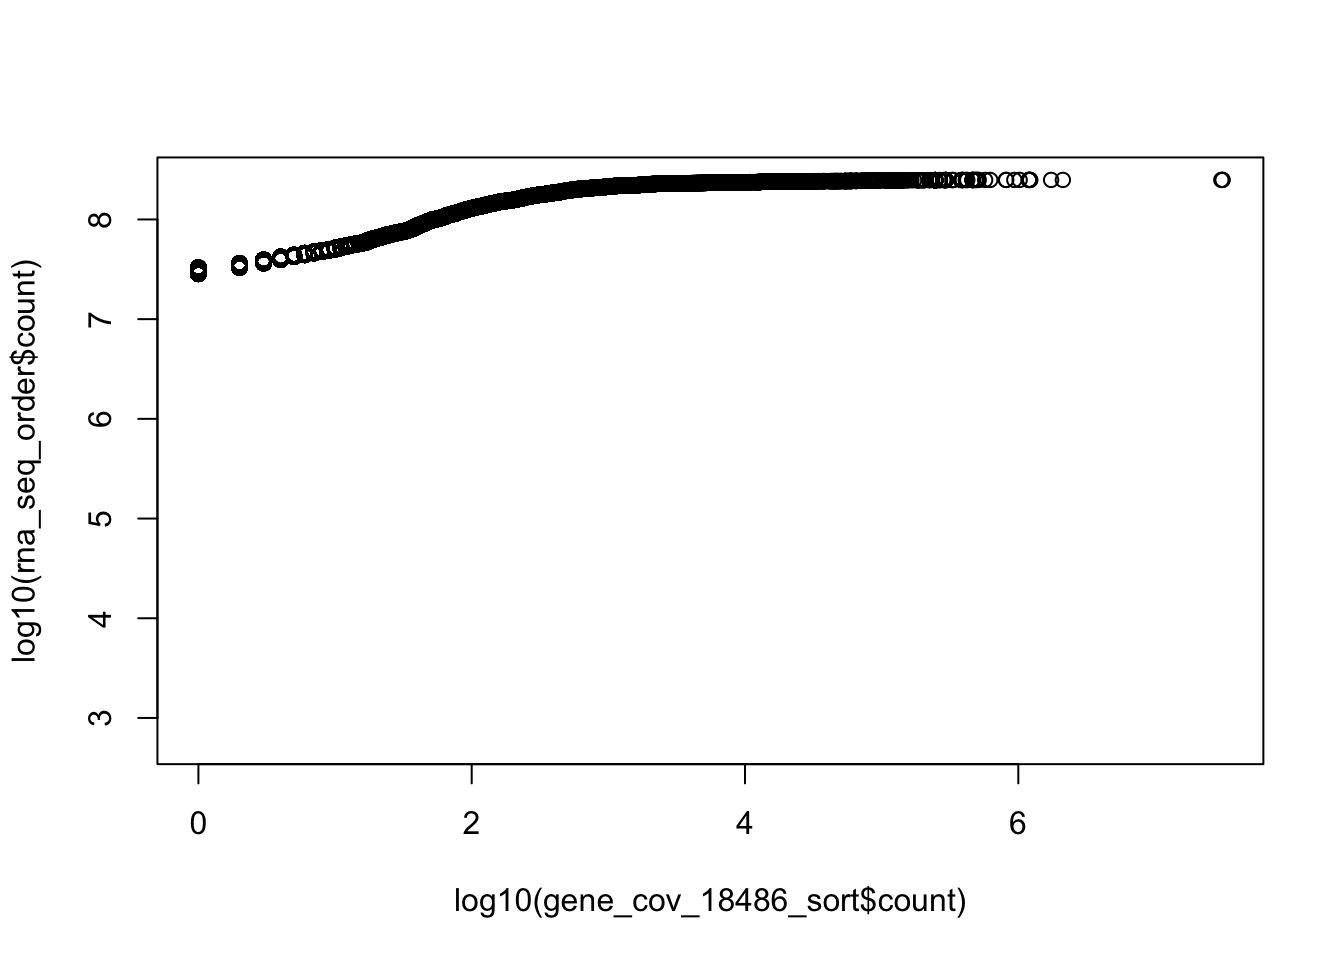
top5000_rna=rna_seq_order[1:5000,]
top5000_net=gene_cov_18486_sort[1:5000,]
plot(log10(top5000_rna$count)~log10(top5000_net$count), xlab="log 10 Netseq", ylab="log10 RNA seq", main="Top 5000 Ranked expression vs Netseq counts for 18486")
abline(0,1)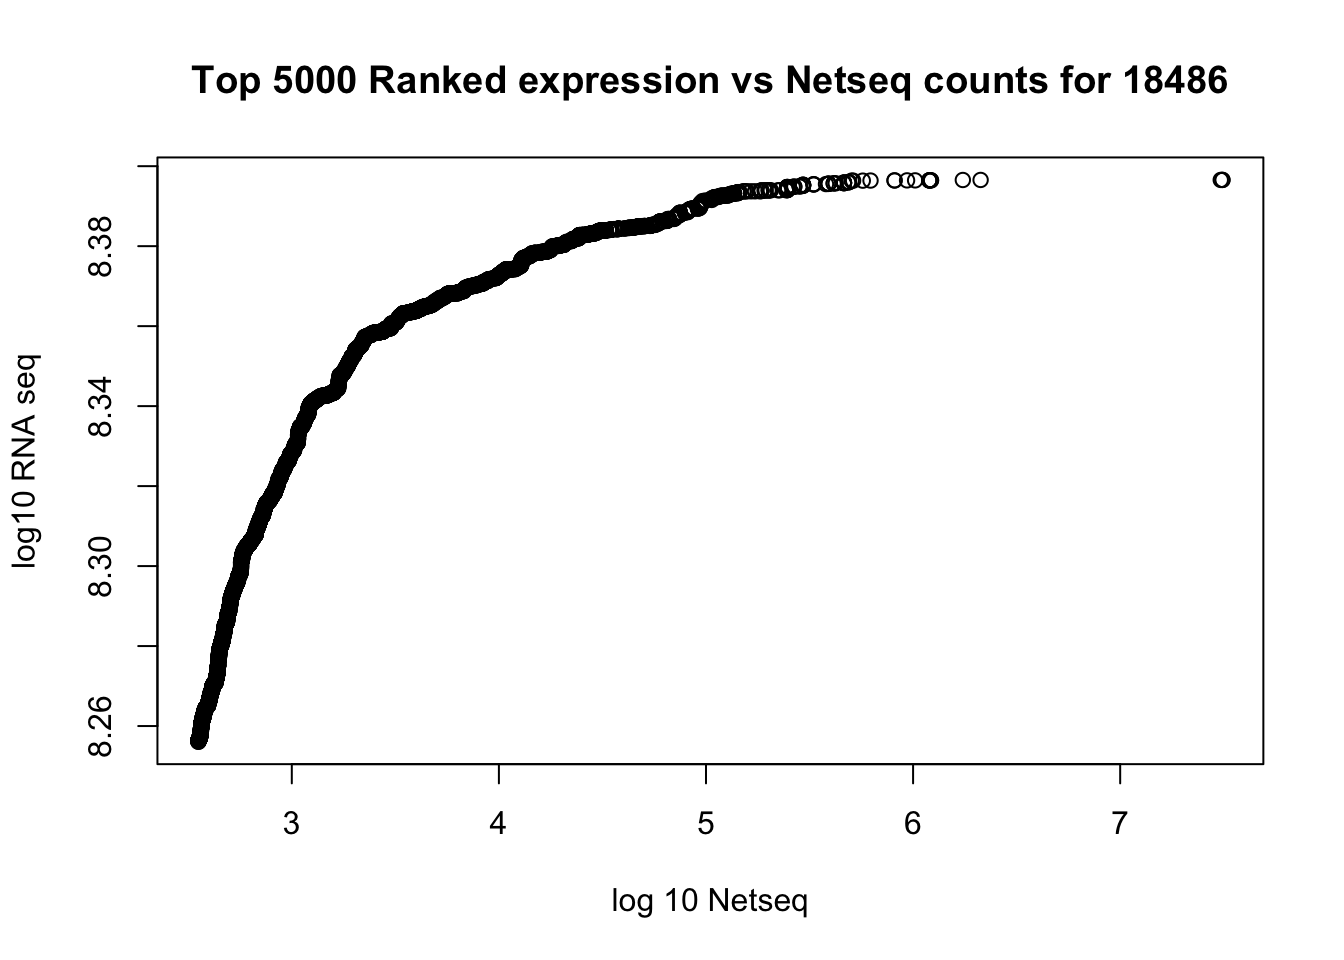
cor(rna_seq_order$count,gene_cov_18486_sort$count)[1] 0.02982312cor(top5000_rna$count, top5000_net$count)[1] 0.07747795How many genes are non zero for netseq?
gene_cov_18486_sort_non0= gene_cov_18486_sort[gene_cov_18486_sort$count != 0,]
nrow(gene_cov_18486_sort_non0)
[1] 74475Look at the reads directly downstream of the tss in the net seq data. Negative strand we want 500 upstream of end to end and for pos strand we want start to 500 ds of start.
less gencode_noCHR_genes_MT_Fsort.bed | awk '{if($6 == "+") print($1 "\t" $2 "\t" $2 + 500 "\t" $4 "\t" $5 "\t" $6); else print($1 "\t" $3 - 500 "\t" $3 "\t" $4 "\t" $5 "\t" $6)}' > gencode_noCHR_genes_MT_Fsort_tss.bed
Script for getting coverage in this file is /project2/gilad/briana/Net-seq-pilot/code/gene_cov_tss.sh
library(dplyr)
Attaching package: 'dplyr'The following objects are masked from 'package:stats':
filter, lagThe following objects are masked from 'package:base':
intersect, setdiff, setequal, uniontss_18486=read.table("../data/NET3-18486.tss.coverage.bed", header=FALSE)
colnames(tss_18486)=c("chr", "start", "end", "gene", "score", "strand", "count")
tss_18486_st = tss_18486 %>% mutate(., st_count=count/500)
rna_seq_genecounts_st = rna_seq_genecounts %>% mutate(., st_count=count/(end-start))Order both by standard counts:
tss_18486_st_order=tss_18486_st[order(tss_18486_st$st_count, decreasing = TRUE),]
rna_seq_genecounts_st_order=rna_seq_genecounts_st[order(rna_seq_genecounts_st$st_count, decreasing = TRUE),]
Correlation:
cor(rna_seq_genecounts_st_order$st_count, tss_18486_st_order$st_count )[1] 0.1449201plot(rna_seq_genecounts_st_order$st_count~tss_18486_st_order$st_count, xlab="standardized Netseq at TSS", ylab="standardized RNA seq", main="Standardized expression vs Netseq standardized TSS counts for 18486")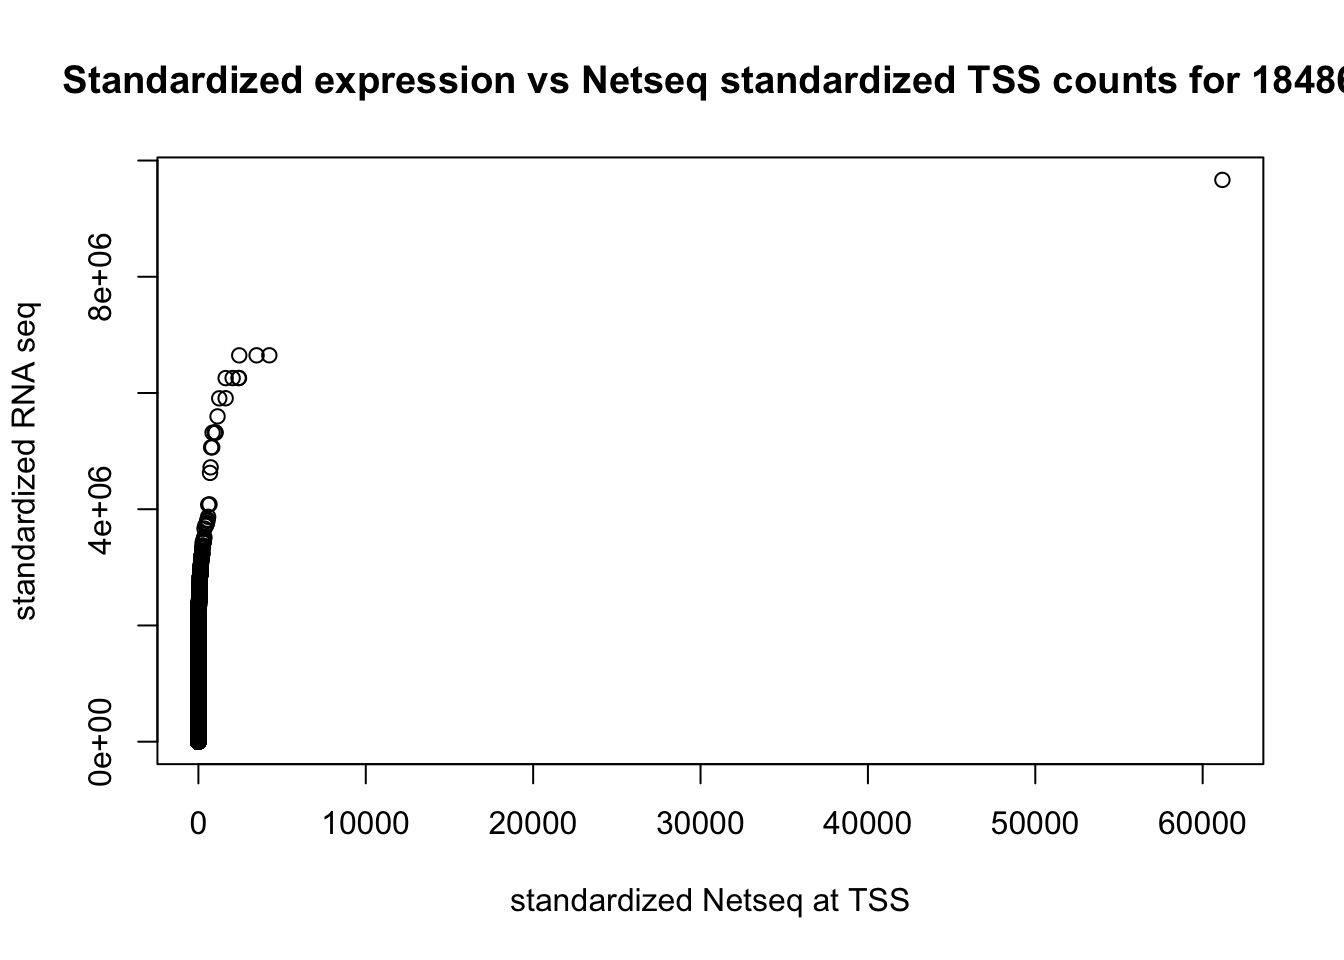 ###Bin genome coverage file into 200bp windows
I already have genome coverage file and I can use bedtools make windows function. This script takes one of the genome coverage bed files and a bed file with 200bp windows. The script is /project2/gilad/briana/Net-seq-pilot/code/window_200_cov.sh
the coverge file is not a bed file because it does not have a start and end. I need to use awk to make it a bedfile
less YG-SP-NET3-18486_combined_Netpilot-sort.cov.bed | awk '{print($1 "\t" $2 "\t" $2 "\t" $3)}' > YG-SP-NET3-18486_combined_Netpilot-sort.cov.fixed.bed#!/bin/bash
#SBATCH --job-name=200_wind
#SBATCH --time=8:00:00
#SBATCH --output=window_sbatch.out
#SBATCH --error=window_sbatch.err
#SBATCH --partition=broadwl
#SBATCH --mem=10G
#SBATCH --mail-type=END
module load Anaconda3
source activate net-seq
sample=$1
describer=$(echo ${sample} | sed -e 's/.*\YG-SP-//' | sed -e "/_combined_Netpilot-sort.cov.fixed.bed$//")
bedtools makewindows -b $1 -w 200 > /project2/gilad/briana/Net-seq-pilot/data/200wind_cov/${describer}_combined_Netpilot-sort.200.cov.bed
/project2/gilad/briana/Net-seq-pilot/data/cov/YG-SP-NET3-18486_combined_Netpilot-sort.cov.fixed.bed
less YG-SP-NET3-18486_combined_Netpilot-sort.cov.fixed.bed | awk '{print($1 "\t" $2 "\t" $2 + 1 )}' > /project2/gilad/briana/genome_anotation_data/genome_1bp_windows
New idea is do this in 2 steps: make the windows then do coverage
This script is /project2/gilad/briana/Net-seq-pilot/code/window_200_cov2.sh
#!/bin/bash

#SBATCH --job-name=200_wind
#SBATCH --time=8:00:00
#SBATCH --output=window_sbatch.out
#SBATCH --error=window_sbatch.err
#SBATCH --partition=broadwl
#SBATCH --mem=20G
#SBATCH --mail-type=END

module load Anaconda3

source activate net-seq

#input is a bed file
sample=$1


describer=$(echo ${sample} | sed -e 's/.*\YG-SP-//' | sed -e "s/_combined_Netpilot-sort.bed$//")


bedtools makewindows -b /project2/gilad/briana/genome_anotation_data/genome_1bp_windows  -w 200 > /project2/gilad/briana/genome_anotation_data/genome_200bp_windows

bedtools coverage -counts -sorted -a  /project2/gilad/briana/genome_anotation_data/genome_200bp_windows  -a $1 > /project2/gilad/briana/Net-seq-pilot/data/200wind_cov/${describer}_combined_Netpilot-sort.200.cov.bed
sbatch window_200_cov2.sh /project2/gilad/briana/Net-seq-pilot/data/bed/YG-SP-NET3-18486_combined_Netpilot-sort.bed
Create the annotation file my self in python:
File with chromosome lengths: hg19.chrlen.txt
import pandas as pd
#FIX with NO HEADER!!
chr_length= pd.read_table("/project2/gilad/briana/Net-seq-pilot/code/hg19.chrlen.txt", header=None)
bed_list=[]
for ind, row in chr_length.iterrows():
    x=chr_length.iloc[ind,1]
    chr=chr_length.iloc[ind,0]
    for i in range(0, x, 200):
        bed_list.append([chr, i, i+200])
bed_df=pd.DataFrame(bed_list)
bed_df.to_csv('/project2/gilad/briana/Net-seq-pilot/code/genome_200_wind.bed', sep="\t")
use awk to get rid of the first line and the first column
less genome_200_wind.bed | awk 'NR >=2 {print($2 "\t" $3 "\t" $4)}' > genome_200_wind_fix.bed Now make a feature counts script:
#!/bin/bash

#SBATCH --job-name=fc_200
#SBATCH --time=8:00:00
#SBATCH --output=fc_200.out
#SBATCH --error=fc_200.err
#SBATCH --partition=broadwl
#SBATCH --mem=20G
#SBATCH --mail-type=END

module load Anaconda3

source activate net-seq

#input is a bed file
sample=$1


describer=$(echo ${sample} | sed -e 's/.*\YG-SP-//' | sed -e "s/_combined_Netpilot-sort.bam$//")


featureCounts -T 5 -a /project2/gilad/briana/Net-seq-pilot/code/genome_200_wind_fix.saf2 -F 'SAF' -o /project2/gilad/briana/Net-seq-pilot/data/200wind_cov/${describer}_combined_Netpilot-sort.FC200.cov.bed $1
imput file /project2/gilad/briana/Net-seq-pilot/data/sort/YG-SP-NET3-18486_combined_Netpilot-sort.bam
awk to make it a gtf file
less genome_200_wind.bed | awk 'NR >=2 {print("exon" "\t" $2 "\t" $3 "\t" $4 "\t" "+")}' > genome_200_wind_fix.safThe working code is the featureCounts version
I have to give each of the bins a different name:
there are 14439596 bins
awk '{ printf ("%.6d %s\n", NR, $0) }' genome_200_wind_fix.saf |awk '{print $1 "\t" $3 "\t" $4 "\t" $5 "\t" $6}'> genome_200_wind_fix2.saf
Fix the first column name. It starts at 000002.
gen_wind200_no0=read.table('../data/NET3-18486_combined_Netpilot-sort.FC200.cov.no0.bed', header=TRUE, stringsAsFactors = FALSE, col.names = c('Geneid', 'Chr', 'Start', 'End', 'Strand', 'Length', 'Counts'), na.strings = "NA")

gen_wind200_no0_order=gen_wind200_no0[order(gen_wind200_no0$Counts, decreasing=TRUE),]

summary(gen_wind200_no0_order$Counts)
Min. 1st Qu. Median Mean 3rd Qu. Max.
1.0 1.0 2.0 66.8 4.0 2118483.0 plot(gen_wind200_no0_order$Counts, ylab='read count', xlab="Bin index", main="Sorted counts per 200bp bin without 0 bins")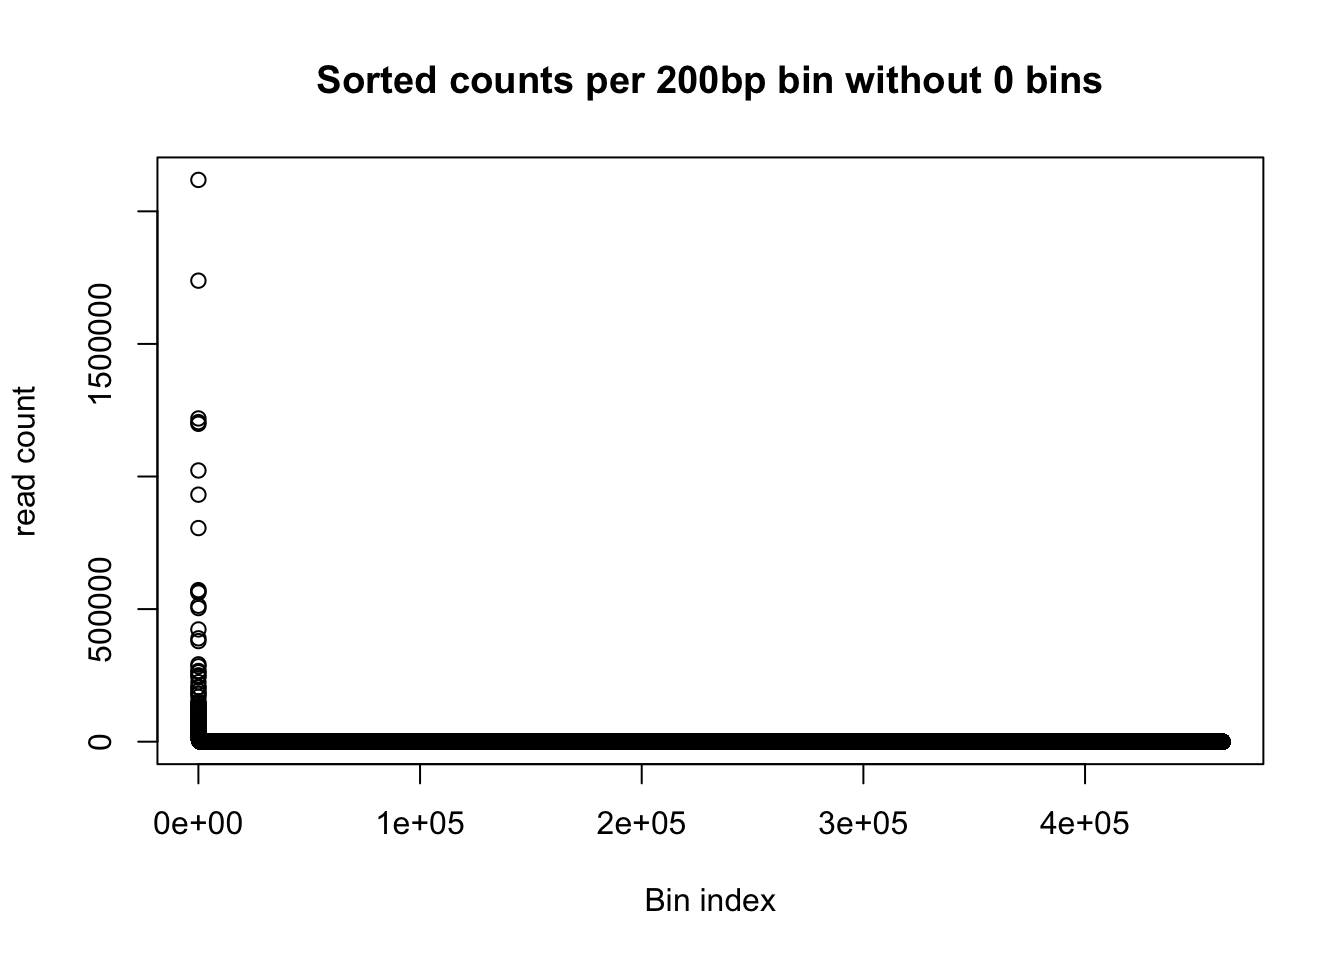
plot(log10(gen_wind200_no0_order$Counts), ylab='log10 read count', xlab="Bin index", main="Sorted counts per 200bp bin without 0 bins")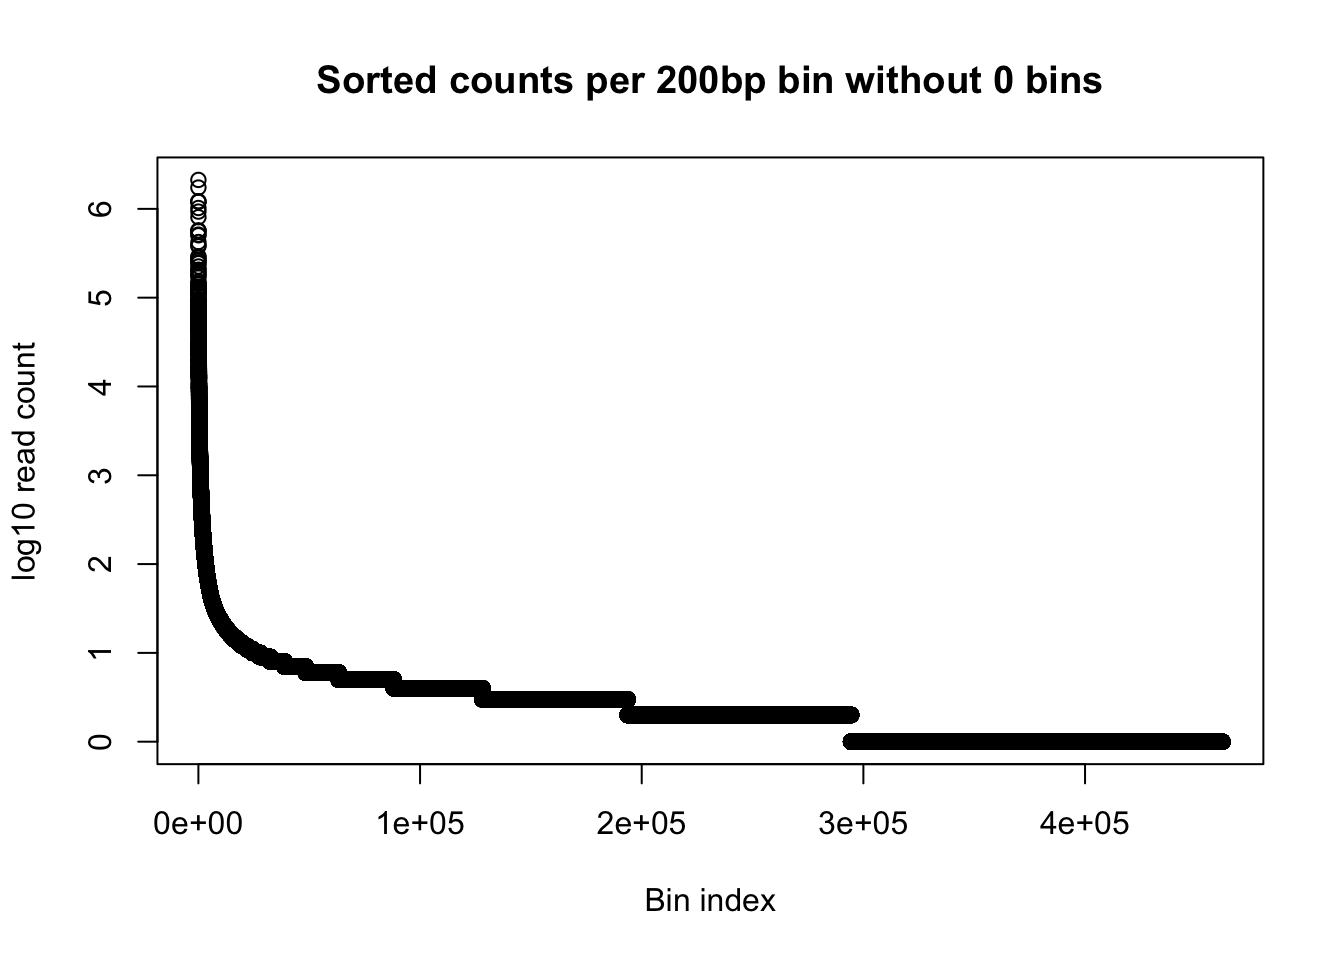
x=gen_wind200_no0_order$Counts[1: 23098]

plot(log10(x),  ylab='log10 read count', xlab="Bin index", main="Sorted counts per 200bp, top 5%")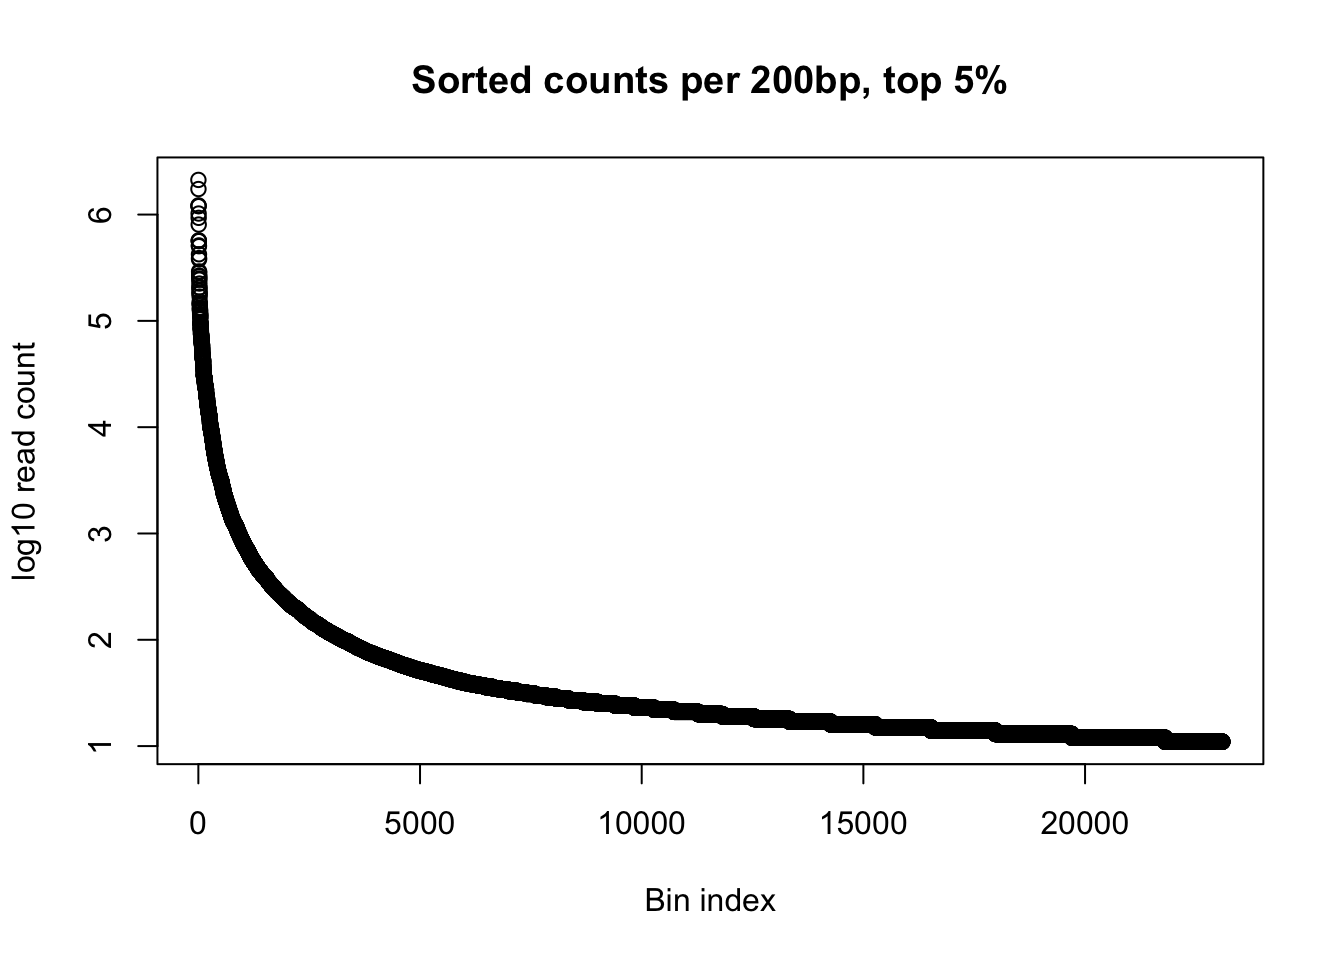
Subset the top 5% of bins:
top5_gen_wind200_no0_order=gen_wind200_no0_order[1:23098,]

head(top5_gen_wind200_no0_order)
Geneid Chr Start End Strand Length Counts
23476 743025 chr1 148604800 148605000 + 201 2118483
344025 12041897 chr15 65597000 65597200 + 201 1738589
344016 12041854 chr15 65588400 65588600 + 201 1218950
229721 8266594 chr9 79186800 79187000 + 201 1205170
257869 9094769 chr10 103124600 103124800 + 201 1198748
23521 746121 chr1 149224000 149224200 + 201 1022751top5_gen_wind200.bed=top5_gen_wind200_no0_order[,2:5]
write.csv(top5_gen_wind200.bed, file = "../data/top5_gen_wind200.bed", row.names = FALSE, quote = FALSE)I need to create a sorted bed file out of this so I can exclude these regions.
cat top5_gen_wind200.bed | tr ',' '\t' > top5_gen_wind200.tab.bed Put in: /project2/gilad/briana/genome_anotation_data
cat top5_gen_wind200.tab.bed |sed 's/^chr//' > top5_gen_wind200.tab.nochr.bed
#remove header in vi
bedtools sort -faidx names.txt -i top5_gen_wind200.tab.nochr.bed > top5_gen_wind200.tab.nochr.sort.bed
Now use intersect to remove genes including these.
/project2/gilad/briana/Net-seq-pilot/code/int.topwind.sh
#!/bin/bash

#SBATCH --job-name=top_intersect
#SBATCH --time=8:00:00
#SBATCH --output=top_int_sbatch.out
#SBATCH --error=top_int_sbatch.err
#SBATCH --partition=broadwl
#SBATCH --mem=10G
#SBATCH --mail-type=END


module load Anaconda3

source activate net-seq


sample=$1

describer=$(echo ${sample} | sed -e 's/.*\gene_cov\///' | sed -e "s/.gene.coverage.bed$//")


bedtools intersect -v -wa -a $1 -b /project2/gilad/briana/genome_anotation_data/top5_gen_wind200.tab.nochr.sort.bed  > /project2/gilad/briana/Net-seq-pilot/data/gene_cov/${describer}.gene.coverage.notopwind.bed
run with /project2/gilad/briana/Net-seq-pilot/data/gene_cov/NET3-18486.gene.coverage.bed
gene_cov_18486_notoo=read.table("../data/NET3-18486.gene.coverage.notopwind.bed")
colnames(gene_cov_18486_notoo)=c("chr", "start", "end", "gene", "score", "strand", "count")
gene_cov_18486_notoo_st= gene_cov_18486_notoo %>% mutate(., st_count=count/(end-start))
gene_cov_18486_notoo_st_order=gene_cov_18486_notoo_st[order(gene_cov_18486_notoo_st$st_count, decreasing=TRUE),]
Run this for all lines to see how similar the top bins are:
The script is FT_200_cov.sh, run on:
sbatch FT_200_cov.sh /project2/gilad/briana/Net-seq-pilot/data/sort/YG-SP-NET3-18505_combined_Netpilot-sort.bam
sbatch FT_200_cov.sh /project2/gilad/briana/Net-seq-pilot/data/sort/YG-SP-NET3-18508_combined_Netpilot-sort.bam
sbatch FT_200_cov.sh /project2/gilad/briana/Net-seq-pilot/data/sort/YG-SP-NET3-19128_combined_Netpilot-sort.bam
sbatch FT_200_cov.sh /project2/gilad/briana/Net-seq-pilot/data/sort/YG-SP-NET3-19141_combined_Netpilot-sort.bam
sbatch FT_200_cov.sh /project2/gilad/briana/Net-seq-pilot/data/sort/YG-SP-NET3-19193_combined_Netpilot-sort.bam
sbatch FT_200_cov.sh /project2/gilad/briana/Net-seq-pilot/data/sort/YG-SP-NET3-19239_combined_Netpilot-sort.bam
sbatch FT_200_cov.sh /project2/gilad/briana/Net-seq-pilot/data/sort/YG-SP-NET3-19257_combined_Netpilot-sort.bam
Remove bins with 0s.
awk '{if ($7 != 0) print}' file > file.no0


awk '{if ($7 != 0) print}' NET3-18508_combined_Netpilot-sort.FC200.cov.bed  > NET3-18508_combined_Netpilot-sort.FC200.cov.no0.bed
awk '{if ($7 != 0) print}' NET3-19128_combined_Netpilot-sort.FC200.cov.bed  > NET3-19128_combined_Netpilot-sort.FC200.cov.no0.bed
awk '{if ($7 != 0) print}' NET3-19141_combined_Netpilot-sort.FC200.cov.bed  > NET3-19141_combined_Netpilot-sort.FC200.cov.no0.bed
awk '{if ($7 != 0) print}' NET3-19193_combined_Netpilot-sort.FC200.cov.bed  > NET3-19193_combined_Netpilot-sort.FC200.cov.no0.bed
awk '{if ($7 != 0) print}' NET3-19239_combined_Netpilot-sort.FC200.cov.bed  > NET3-19239_combined_Netpilot-sort.FC200.cov.no0.bed
awk '{if ($7 != 0) print}' NET3-19257_combined_Netpilot-sort.FC200.cov.bed  > NET3-19257_combined_Netpilot-sort.FC200.cov.no0.bed
top_5_wind=function(file){
wind200_no0=read.table(file, header=TRUE, stringsAsFactors = FALSE, col.names = c('Geneid', 'Chr', 'Start', 'End', 'Strand', 'Length', 'Counts'), na.strings = "NA")
wind200_no0_order=wind200_no0[order(wind200_no0$Counts, decreasing=TRUE),]
x=.5*nrow(wind200_no0_order)
top5_wind200_no0_order=wind200_no0_order[1:x,]
return(top5_wind200_no0_order$Geneid)
}
#test=top_5_wind('../data/NET3-18486_combined_Netpilot-sort.FC200.cov.no0.bed')top5_bin_18486=top_5_wind('../data/NET3-18486_combined_Netpilot-sort.FC200.cov.no0.bed')
top5_bin_18505=top_5_wind('../data/NET3-18505_combined_Netpilot-sort.FC200.cov.no0.bed')
top5_bin_18508=top_5_wind('../data/NET3-18508_combined_Netpilot-sort.FC200.cov.no0.bed')
top5_bin_19128=top_5_wind('../data/NET3-19128_combined_Netpilot-sort.FC200.cov.no0.bed')
top5_bin_19141=top_5_wind('../data/NET3-19141_combined_Netpilot-sort.FC200.cov.no0.bed')
top5_bin_19193=top_5_wind('../data/NET3-19193_combined_Netpilot-sort.FC200.cov.no0.bed')
top5_bin_19239=top_5_wind('../data/NET3-19239_combined_Netpilot-sort.FC200.cov.no0.bed')
top5_bin_19257=top_5_wind('../data/NET3-19257_combined_Netpilot-sort.FC200.cov.no0.bed')Look for snoRNA, SNRNA,hNRP
Make files in the genome annotation file.
less gencode.v19.annotation.gtf | tr "\"" "\t" | awk '$3 == "gene"' | awk '{print $16}' | sort | uniq > gene.type.txt Both snRNA and snoRNA are in this file. I will make a seperate bed file for each of these:
less gencode.v19.annotation.gtf | tr "\"" "\t" | awk '$3 == "gene"' | awk '$16 == "snRNA"' |  awk '{print($1 "\t" $4  "\t" $5 "\t" $10 "\t0\t" $7 )}' > snRNA.gencode.v19.bed


less gencode.v19.annotation.gtf | tr "\"" "\t" | awk '$3 == "gene"' |  awk '$16 == "snoRNA"' | awk '{print($1 "\t" $4  "\t" $5 "\t" $10 "\t0\t" $7 )}' > snoRNA.gencode.v19.bed
Cut the chr tag out.
cat snRNA.gencode.v19.bed |sed 's/^chr//' > snRNA.gencode.v19.nochr.bed
cat snoRNA.gencode.v19.bed  | sed 's/chr//' >  snoRNA.gencode.v19.nochr.bed
I now want to intersect these with /project2/gilad/briana/Net-seq-pilot/data/gene_cov/NET3-18486.gene.coverage.bed to take out the small RNAs.
Following code is /project2/gilad/briana/Net-seq-pilot/code/intersect_sn_sno.sh
#!/bin/bash

#SBATCH --job-name=intersect
#SBATCH --time=8:00:00
#SBATCH --output=int_sbatch.out
#SBATCH --error=int_sbatch.err
#SBATCH --partition=broadwl
#SBATCH --mem=10G
#SBATCH --mail-type=END


module load Anaconda3

source activate net-seq


sample=$1

describer=$(echo ${sample} | sed -e 's/.*\gene_cov\///' | sed -e "s/.gene.coverage.bed$//")


bedtools intersect -v -wa -a $1 -b /project2/gilad/briana/genome_anotation_data/snRNA.gencode.v19.nochr.bed /project2/gilad/briana/genome_anotation_data/snoRNA.gencode.v19.nochr.bed  > /project2/gilad/briana/Net-seq-pilot/data/gene_cov/${describer}.gene.coverage.nosn.nosno.bed
gene_cov_18486_srnafilter=read.table("../data/NET3-18486.gene.coverage.nosn.nosno.bed", header=FALSE)
colnames(gene_cov_18486_srnafilter)= c("chr", "start", "end", "gene", "score", "strand", "count")
gene_cov_18486_srnafilter_st = gene_cov_18486_srnafilter%>% mutate(., st_count=count/(end-start))
gene_cov_18486_srnafilter_st_order=gene_cov_18486_srnafilter_st[order(gene_cov_18486_srnafilter_st$st_count, decreasing=TRUE),]
#standardize read count by length
gene_cov_18486_sort_st = gene_cov_18486_sort %>% mutate(., st_count=count/(end-start))
gene_cov_18486_sort_st_order= gene_cov_18486_sort_st[order(gene_cov_18486_sort_st$st_count, decreasing=TRUE),]par(mfrow = c(1,2))
withsRNA=plot(log10(gene_cov_18486_sort_st_order$st_count), ylab="log10 read count st. by gene length", main="Netseq read coverage", xlab="Gene")
nosRNA=plot(log10(gene_cov_18486_srnafilter_st_order$st_count), ylab="log10 read count st. by gene length", main="Netseq read coverage without snRNAs or snoRNAs", xlab="Gene")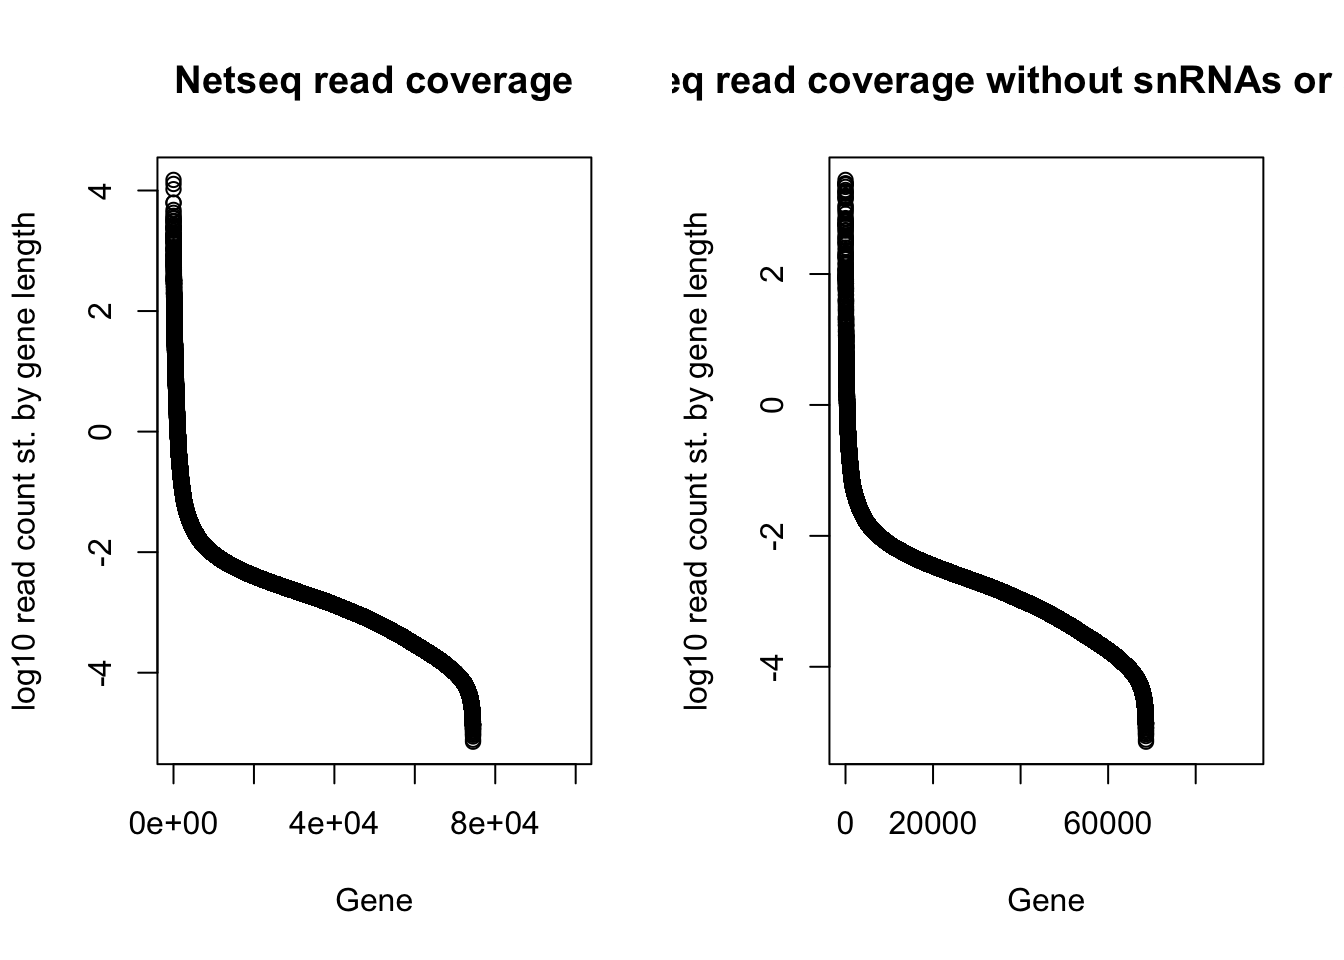
Add rRNAs to this analysis:
less gencode.v19.annotation.gtf | tr "\"" "\t" | awk '$3 == "gene"' | awk '$16 == "rRNA"' |  awk '{print($1 "\t" $4  "\t" $5 "\t" $10 "\t0\t" $7 )}' > rRNA.gencode.v19.bed
cat rRNA.gencode.v19.bed  | sed 's/chr//' >  rRNA.gencode.v19.nochr.bed
#!/bin/bash
#SBATCH --job-name=intersect_small
#SBATCH --time=8:00:00
#SBATCH --output=intSM_sbatch.out
#SBATCH --error=intSM_sbatch.err
#SBATCH --partition=broadwl
#SBATCH --mem=10G
#SBATCH --mail-type=END
module load Anaconda3
source activate net-seq
sample=$1
describer=$(echo ${sample} | sed -e 's/.*\gene_cov\///' | sed -e "s/.gene.coverage.bed$//")
bedtools intersect -v -wa -a $1 -b /project2/gilad/briana/genome_anotation_data/snRNA.gencode.v19.nochr.bed /project2/gilad/briana/genome_anotation_data/snoRNA.gencode.v19.nochr.bed /project2/gilad/briana/genome_anotation_data/rRNA.gencode.v19.nochr.bed > /project2/gilad/briana/Net-seq-pilot/data/gene_cov/${describer}.gene.coverage.noSM.bed
gene_cov_18486_smallfilter=read.table("../data/NET3-18486.gene.coverage.noSM.bed", header=FALSE)
colnames(gene_cov_18486_smallfilter)= c("chr", "start", "end", "gene", "score", "strand", "count")
gene_cov_18486_smallfilter_st = gene_cov_18486_smallfilter%>% mutate(., st_count=count/(end-start))
gene_cov_18486_smallfilter_st_order =gene_cov_18486_smallfilter_st[order(gene_cov_18486_smallfilter_st$st_count, decreasing=TRUE),]
plot all 4:
par(mfrow = c(2,2))
withsRNA=plot(log10(gene_cov_18486_sort_st_order$st_count), ylab="log10 read count st. by gene length", main="Netseq read coverage", xlab="Gene index",  ylim=c(-5,5))
nosRNA=plot(log10(gene_cov_18486_srnafilter_st_order$st_count), ylab="log10 read count st. by gene length", main="Netseq read coverage without snRNAs or snoRNAs", xlab="Gene index ",  ylim=c(-5,5))
noSM=plot(log10(gene_cov_18486_smallfilter_st_order$st_count), ylab="log10 read count st. by gene length", main="Netseq read coverage without snRNA, snoRNA, rRNA", xlab="Gene index",  ylim=c(-5,5))
no_topwind=plot(log10(gene_cov_18486_notoo_st_order$st_count), ylab="log10 read count st. by gene length", main="Netseq read coverage without top 5% of windows", xlab="Gene index",  ylim=c(-5,5))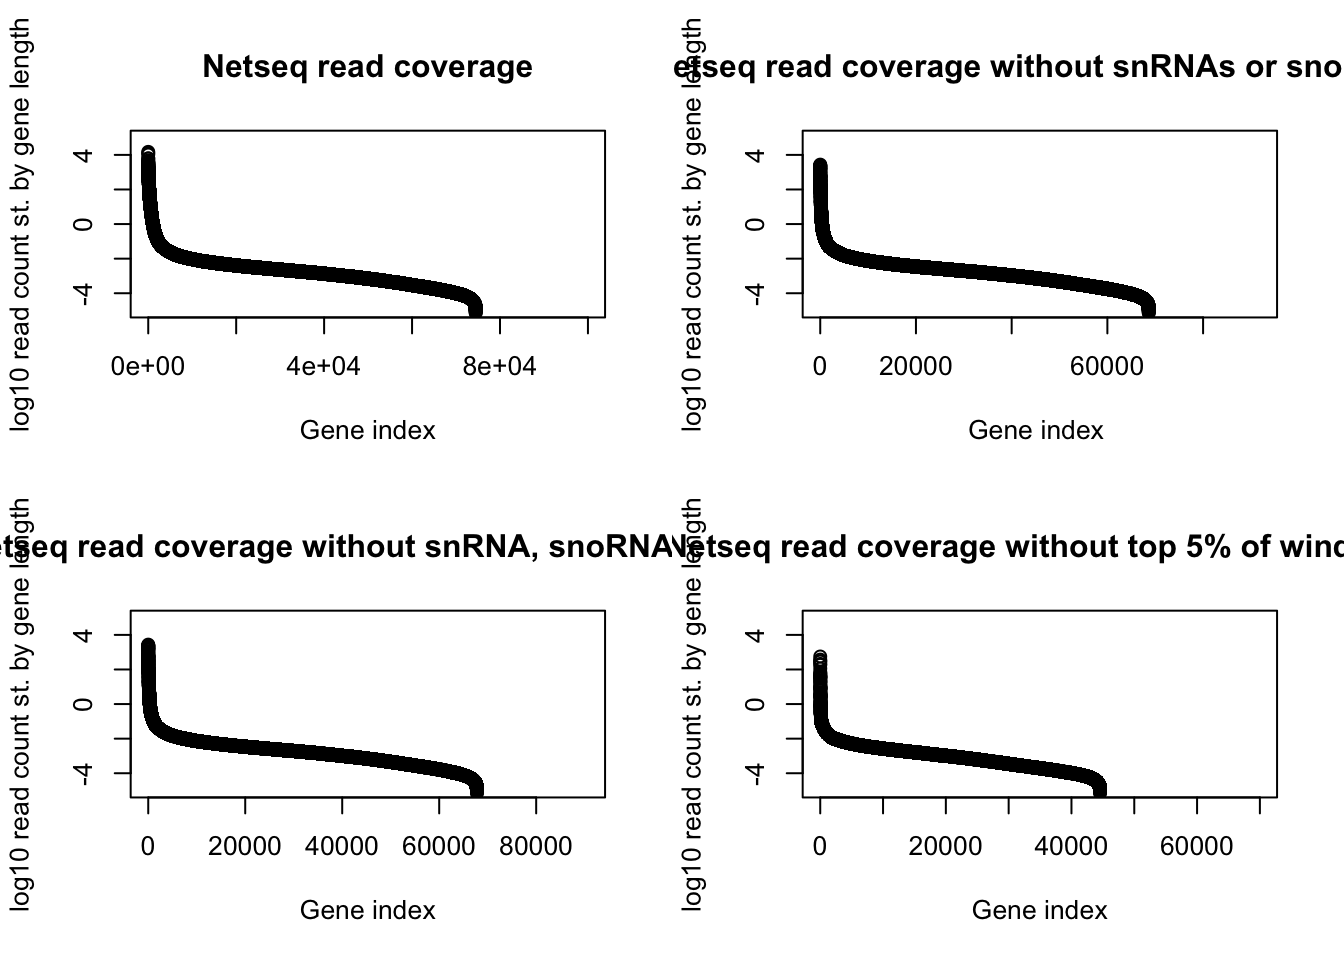
Bedtools intersect to remove:
Meta plots on filtered data:
First: use samtools intersect to remove these regions from the bam files
* /project2/gilad/briana/Net-seq-pilot/code/filter_bams.sh
#!/bin/bash

#SBATCH --job-name=bamintersect
#SBATCH --time=8:00:00
#SBATCH --output=bamint_sbatch.out
#SBATCH --error=bamint_sbatch.err
#SBATCH --partition=broadwl
#SBATCH --mem=40G
#SBATCH --mail-type=END


module load Anaconda3

source activate net-seq


sample=$1


describer=$(echo ${sample} | sed -e 's/.*\YG-SP-//' | sed -e "s/_combined_Netpilot-sort.bam$//")


bedtools intersect -abam $1 -b /project2/gilad/briana/genome_anotation_data/top5_gen_wind200.tab.nochr.sort.bed -v > /project2/gilad/briana/Net-seq-pilot/data/filter_bam/${describer}.Netpilot.binfilter.bam
run on /project2/gilad/briana/Net-seq-pilot/data/sort/YG-SP-NET3-18486_combined_Netpilot-sort.bam
index this bam
Make the deep tools plot at TSS:
dt_tss_filter_18486.sh
#!/bin/bash


#SBATCH --job-name=dt_tss_18486
#SBATCH --time=8:00:00
#SBATCH --partition=gilad
#SBATCH --mem=16G
#SBATCH --mail-type=END
#SBATCH --output=dt_tss_18486_sbatch.out
#SBATCH --error=dt_tss_18486_sbatch.err

module load Anaconda3

source activate net-seq

bamCoverage -b /project2/gilad/briana/Net-seq-pilot/data/filter_bam/NET3-18486.Netpilot.binfilter.bam -o /project2/gilad/briana/Net-seq-pilot/output/deeptools/NET3-18486.Netpilot.binfilter.bw

computeMatrix reference-point -S/project2/gilad/briana/Net-seq-pilot/output/deeptools/NET3-18486.Netpilot.binfilter.bw -R /project2/gilad/briana/genome_anotation_data/gencode.v19.annotation.bed --referencePoint TSS -b 500 -a 500 -out /project2/gilad/briana/Net-seq-pilot/output/deeptools/NET3-18486.Netpilot.binfilter.gz

plotHeatmap --sortRegions descend  --refPointLabel "TSS"   -m /project2/gilad/briana/Net-seq-pilot/output/deeptools/NET3-18486.Netpilot.binfilter.gz  -out /project2/gilad/briana/Net-seq-pilot/output/deeptools/NET3-18486.Netpilot.binfilter.gz.png
dt_tes_filter_18486.sh
#!/bin/bash


#SBATCH --job-name=dt_tes_18486
#SBATCH --time=8:00:00
#SBATCH --partition=gilad
#SBATCH --mem=20G
#SBATCH --mail-type=END
#SBATCH --output=dt_tes_18486_sbatch.out
#SBATCH --error=dt_tes_18486_sbatch.err

module load Anaconda3

source activate net-seq

#bw created in tss plot

computeMatrix reference-point -S /project2/gilad/briana/Net-seq-pilot/output/deeptools/NET3-18486.Netpilot.binfilter.bw -R /project2/gilad/briana/genome_anotation_data/gencode.v19.annotation.bed --referencePoint TES -b 500 -a 500 -out /project2/gilad/briana/Net-seq-pilot/output/deeptools/NET3-18486.TES.Netpilot.binfilter.gz

plotHeatmap --sortRegions descend  --refPointLabel "TES"   -m /project2/gilad/briana/Net-seq-pilot/output/deeptools/NET3-18486.TES.Netpilot.binfilter.gz  -out /project2/gilad/briana/Net-seq-pilot/output/deeptools/NET3-18486.TES.Netpilot.binfilter.gz.png
PAS
dt_pas_filter_18486.sh
#!/bin/bash


#SBATCH --job-name=deeptools_pas_netseq
#SBATCH --time=8:00:00
#SBATCH --partition=broadwl
#SBATCH --mem=40G
#SBATCH --tasks-per-node=4
#SBATCH --mail-type=END
#SBATCH --output=deeptool_pas_sbatch.out
#SBATCH --error=deeptools_pas_sbatch.err

module load Anaconda3

source activate net-seq

#the bw file has already been created

computeMatrix reference-point -S /project2/gilad/briana/Net-seq-pilot/output/deeptools/NET3-18486.Netpilot.binfilter.bw -R /project2/gilad/briana/apa_sites/clusters.bed -b 500 -a 500 -out /project2/gilad/briana/Net-seq-pilot/output/deeptools/NET3-18486.PAS.Netpilot.binfilter.gz

plotHeatmap --sortRegions descend --refPointLabel "PAS"  -m /project2/gilad/briana/Net-seq-pilot/output/deeptools/NET3-18486.PAS.Netpilot.binfilter.gz  -out /project2/gilad/briana/Net-seq-pilot/output/deeptools/NET3-18486.PAS.Netpilot.binfilter.png
dt_3ss_filter_18486.sh
#!/bin/bash


#SBATCH --job-name=deeptools_3_netseq
#SBATCH --time=8:00:00
#SBATCH --partition=broadwl
#SBATCH --mem=40G
#SBATCH --mail-type=END
#SBATCH --output=deeptool_3_sbatch.out
#SBATCH --error=deeptools_3_sbatch.err

module load Anaconda3

source activate net-seq

#the bw file has already been created

computeMatrix reference-point -S /project2/gilad/briana/Net-seq-pilot/output/deeptools/NET3-18486.Netpilot.binfilter.bw   -R /project2/gilad/briana/Net-seq/Net-seq3/gencode.v19.3prime.noE1noTES.bed -b 500 -a 500 -out /project2/gilad/briana/Net-seq-pilot/output/deeptools/NET3-18486.3SS.Netpilot.binfilter.gz

plotHeatmap --sortRegions descend --refPointLabel "3'splice boundary" -m /project2/gilad/briana/Net-seq-pilot/output/deeptools/NET3-18486.3SS.Netpilot.binfilter.gz  -out /project2/gilad/briana/Net-seq-pilot/output/deeptools/NET3-18486.3SS.Netpilot.binfilter.png
dt_5ss_filter_18486.sh
#!/bin/bash


#SBATCH --job-name=deeptools_5_netseq
#SBATCH --time=8:00:00
#SBATCH --partition=broadwl
#SBATCH --mem=40G
#SBATCH --mail-type=END
#SBATCH --output=deeptool_5_sbatch.out
#SBATCH --error=deeptools_5_sbatch.err

module load Anaconda3

source activate net-seq

#the bw file has already been created

computeMatrix reference-point -S  /project2/gilad/briana/Net-seq/Net-seq3/output/deeptools/net-seq-18486.bw -R /project2/gilad/briana/Net-seq/Net-seq3/gencode.v19.5prime.noE1noTES.bed -b 500 -a 500 -out /project2/gilad/briana/Net-seq-pilot/output/deeptools/NET3-18486.5SS.Netpilot.binfilter.gz

plotHeatmap --sortRegions descend --refPointLabel "5' splice boundary" -m /project2/gilad/briana/Net-seq-pilot/output/deeptools/NET3-18486.5SS.Netpilot.binfilter.gz  -out /project2/gilad/briana/Net-seq-pilot/output/deeptools/NET3-18486.5SS.Netpilot.binfilter.png
CTCF
dt_ctcf_filter_18486.sh
#!/bin/bash


#SBATCH --job-name=deeptools_ctcf_netseq
#SBATCH --time=8:00:00
#SBATCH --partition=broadwl
#SBATCH --mem=40G
#SBATCH --tasks-per-node=4
#SBATCH --mail-type=END
#SBATCH --output=deeptool_ctcf_sbatch.out
#SBATCH --error=deeptools_ctcf_sbatch.err

module load Anaconda3

source activate net-seq

#the bw file has already been created

computeMatrix reference-point -S /project2/gilad/briana/Net-seq/Net-seq3/output/deeptools/net-seq-18486.bw -R /project2/gilad/briana/Net-seq/Net-seq3/GM12873-DS14433.peaks.fdr0.01.hg19.bed -b 500 -a 500 -out /project2/gilad/briana/Net-seq-pilot/output/deeptools/NET3-18486.ctcf.Netpilot.binfilter.gz

plotHeatmap --sortRegions descend --refPointLabel "CTCF"  -m /project2/gilad/briana/Net-seq-pilot/output/deeptools/NET3-18486.ctcf.Netpilot.binfilter.gz  -out /project2/gilad/briana/Net-seq-pilot/output/deeptools/NET3-18486.ctcf.Netpilot.binfilter.png
Session information
sessionInfo()R version 3.4.2 (2017-09-28)
Platform: x86_64-apple-darwin15.6.0 (64-bit)
Running under: macOS Sierra 10.12.6
Matrix products: default
BLAS: /Library/Frameworks/R.framework/Versions/3.4/Resources/lib/libRblas.0.dylib
LAPACK: /Library/Frameworks/R.framework/Versions/3.4/Resources/lib/libRlapack.dylib
locale:
[1] en_US.UTF-8/en_US.UTF-8/en_US.UTF-8/C/en_US.UTF-8/en_US.UTF-8
attached base packages:
[1] stats graphics grDevices utils datasets methods base
other attached packages:
[1] bindrcpp_0.2 dplyr_0.7.4 ggplot2_2.2.1
loaded via a namespace (and not attached):
[1] Rcpp_0.12.15 bindr_0.1 knitr_1.18 magrittr_1.5
[5] munsell_0.4.3 colorspace_1.3-2 R6_2.2.2 rlang_0.1.6
[9] stringr_1.2.0 plyr_1.8.4 tools_3.4.2 grid_3.4.2
[13] gtable_0.2.0 git2r_0.21.0 htmltools_0.3.6 assertthat_0.2.0
[17] yaml_2.1.16 lazyeval_0.2.1 rprojroot_1.3-2 digest_0.6.14
[21] tibble_1.4.2 glue_1.2.0 evaluate_0.10.1 rmarkdown_1.8.5
[25] labeling_0.3 stringi_1.1.6 compiler_3.4.2 pillar_1.1.0
[29] scales_0.5.0 backports_1.1.2 jsonlite_1.5 reticulate_1.4
[33] pkgconfig_2.0.1 This R Markdown site was created with workflowr