Reformat data for ggplot 2
First Last
2017-12-08
Last updated: 2017-12-08
Code version: eeeae88
Import Data and packages:
Packages:
library(ggplot2)
library(dplyr)
Attaching package: 'dplyr'The following objects are masked from 'package:stats':
filter, lagThe following objects are masked from 'package:base':
intersect, setdiff, setequal, unionData:
gene_coverage_18486_count= read.csv("../data/gene_cov_count/gene_coverage_18486_count.txt", header=FALSE, sep="\t")

gene_coverage_18508_dep_count= read.csv("../data/gene_cov_count/gene_coverage_18508_dep_count.txt", header=FALSE, sep="\t")

gene_coverage_18508_nondep_count= read.csv("../data/gene_cov_count/gene_coverage_18508_nondep_count.txt", header=FALSE, sep="\t")

gene_coverage_19238_dep_count= read.csv("../data/gene_cov_count/gene_coverage_19238_dep_count.txt", header=FALSE, sep="\t")

gene_coverage_mayer_dep_count = read.csv("../data/gene_cov_count/gene_coverage_mayer_SRR1575922_count.txt", header=FALSE, sep="\t")
Add col names:
colnames(gene_coverage_18486_count) = c("chr", "start", "end", "name", "score", "strand", "counts")
colnames(gene_coverage_18508_dep_count)= c("chr", "start", "end", "name", "score", "strand", "counts")
colnames(gene_coverage_18508_nondep_count)=c("chr", "start", "end", "name", "score", "strand", "counts")
colnames(gene_coverage_19238_dep_count)= c("chr", "start", "end", "name", "score", "strand", "counts")
colnames(gene_coverage_mayer_dep_count)= c("chr", "start", "end", "name", "score", "strand", "counts")
Reformat each file
Add a column to each file with the library using dplyr.
gene_coverage_18486_count= mutate(gene_coverage_18486_count, library="lib_18486")
gene_coverage_18508_dep_count= mutate(gene_coverage_18508_dep_count, library="lib_18508_dep")
gene_coverage_18508_nondep_count= mutate(gene_coverage_18508_nondep_count, library="lib_18508_nondep")
gene_coverage_19238_dep_count= mutate(gene_coverage_19238_dep_count, library="lib_19238")
gene_coverage_mayer_dep_count= mutate(gene_coverage_mayer_dep_count, library="lib_mayer")
Combine files
gene_cov_all_ggplot= bind_rows(gene_coverage_18486_count,gene_coverage_18508_dep_count,gene_coverage_18508_nondep_count,gene_coverage_19238_dep_count, gene_coverage_mayer_dep_count )Make plots
Make a violin plot:
violin_plot_gene_counts= ggplot(gene_cov_all_ggplot, aes(library, counts/(end-start))) + geom_violin() + labs(x="Library", y="Gene count standardized by length", title="Standard gene count violin plots")
violin_plot_gene_counts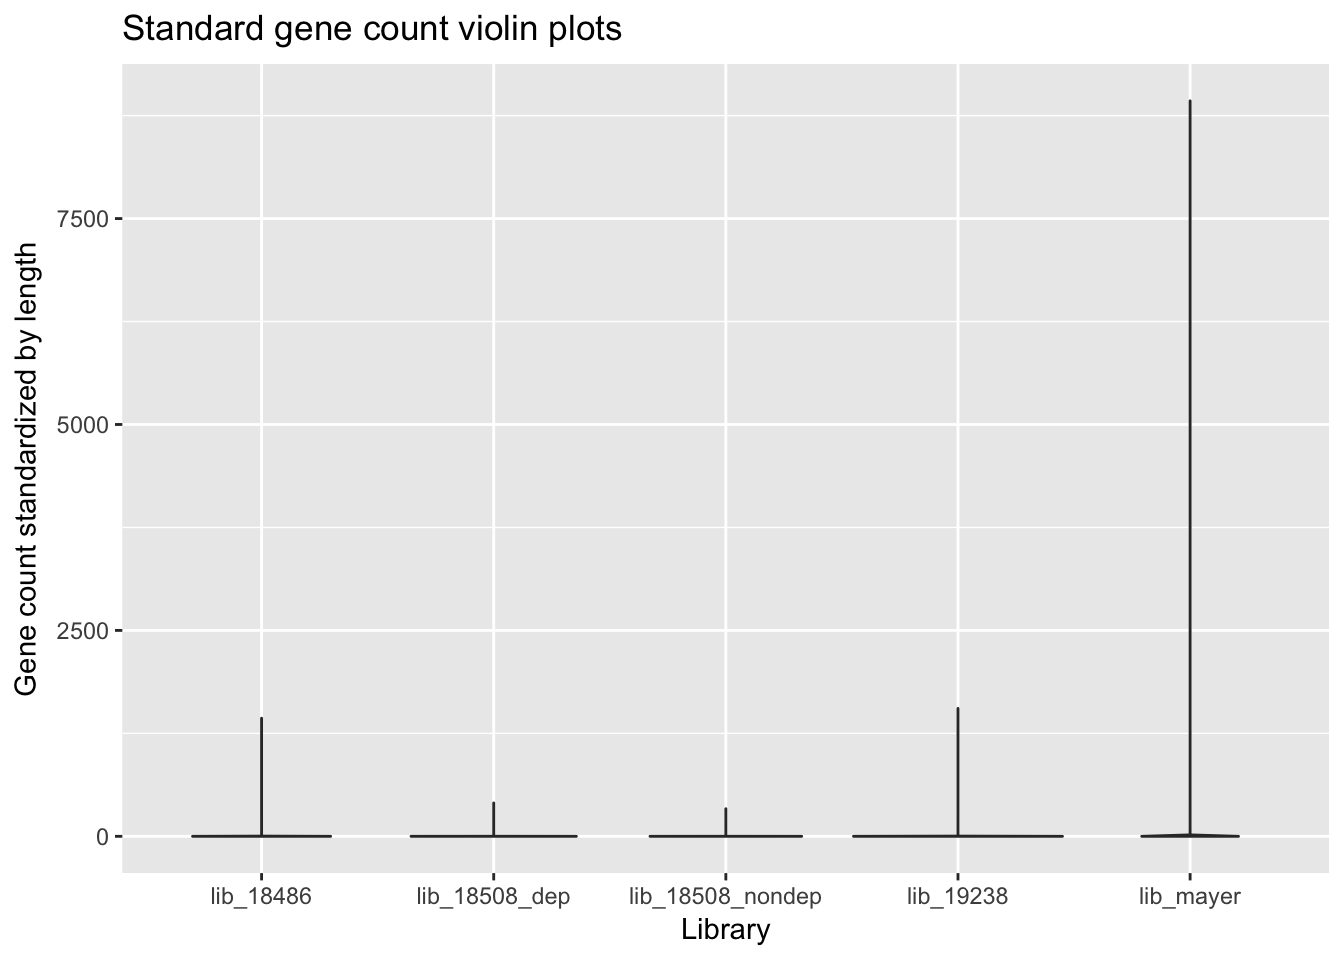
Session information
sessionInfo()R version 3.4.2 (2017-09-28)
Platform: x86_64-apple-darwin15.6.0 (64-bit)
Running under: macOS Sierra 10.12.6
Matrix products: default
BLAS: /Library/Frameworks/R.framework/Versions/3.4/Resources/lib/libRblas.0.dylib
LAPACK: /Library/Frameworks/R.framework/Versions/3.4/Resources/lib/libRlapack.dylib
locale:
[1] en_US.UTF-8/en_US.UTF-8/en_US.UTF-8/C/en_US.UTF-8/en_US.UTF-8
attached base packages:
[1] stats graphics grDevices utils datasets methods base
other attached packages:
[1] dplyr_0.7.4 ggplot2_2.2.1
loaded via a namespace (and not attached):
[1] Rcpp_0.12.13 bindr_0.1 knitr_1.17 magrittr_1.5
[5] munsell_0.4.3 colorspace_1.3-2 R6_2.2.2 rlang_0.1.4
[9] stringr_1.2.0 plyr_1.8.4 tools_3.4.2 grid_3.4.2
[13] gtable_0.2.0 git2r_0.19.0 htmltools_0.3.6 yaml_2.1.14
[17] lazyeval_0.2.1 rprojroot_1.2 digest_0.6.12 assertthat_0.2.0
[21] tibble_1.3.4 bindrcpp_0.2 glue_1.2.0 evaluate_0.10.1
[25] rmarkdown_1.6 labeling_0.3 stringi_1.1.5 compiler_3.4.2
[29] scales_0.5.0 backports_1.1.1 pkgconfig_2.0.1 This R Markdown site was created with workflowr