Initial Data Exploration Netseq1
Brina Mittleman
2017-11-06
Last updated: 2017-11-27
Code version: c9cf54b
I will use this analysis to look at inital data QC and points of interests.
First I looked at the number of reads that mapp to the genome before and after deduplication UMI steps.
samtools view -c -F 4
For flag info: https://broadinstitute.github.io/picard/explain-flags.html
Mayer data: fastq: 137281933
sorted: 120124203 dedup: 2262387
dedup/sorted: 0.01883373
library= c( "18486-dep", "18508-dep", "18508-nondep", "19238-dep", "mayer")

fastq= c( 45803834, 70776230, 77223987, 113160855, 137281933)

sorted= c(17336796,  43247747, 50189574, 40420633, 17157730 )

dedup= c(1533069,  1776330,1919904,
1870359,2262387)

perc= dedup/sorted

reads_mapped_dedup= data.frame(rbind(library, fastq, sorted, dedup, perc))

reads_mapped_dedup
X1 X2 X3
library 18486-dep 18508-dep 18508-nondep
fastq 45803834 70776230 77223987
sorted 17336796 43247747 50189574
dedup 1533069 1776330 1919904
perc 0.0884286231435151 0.0410733534859053 0.0382530443474177
X4 X5
library 19238-dep mayer
fastq 113160855 137281933
sorted 40420633 17157730
dedup 1870359 2262387
perc 0.0462723827209732 0.131858177043234total_reads= sum(fastq)
sorted/fastq[1] 0.3785010 0.6110490 0.6499221 0.3571962 0.1249817Make a stacked bar plot to show complexity and coverage.
library, fastq, mapped, dedup
counts= rbind(fastq, sorted, dedup)
colnames(counts)= library
count_plot=barplot(as.matrix(counts), main="Counts for coverage and complexity",
  xlab="Library", col=c("lightskyblue2","dodgerblue1","navy"),
    ylab="Read counts")
legend("topleft", legend = c("total", "mapped", "UMI"), col=c("lightskyblue2","dodgerblue1","navy"), pch=20, cex = .75)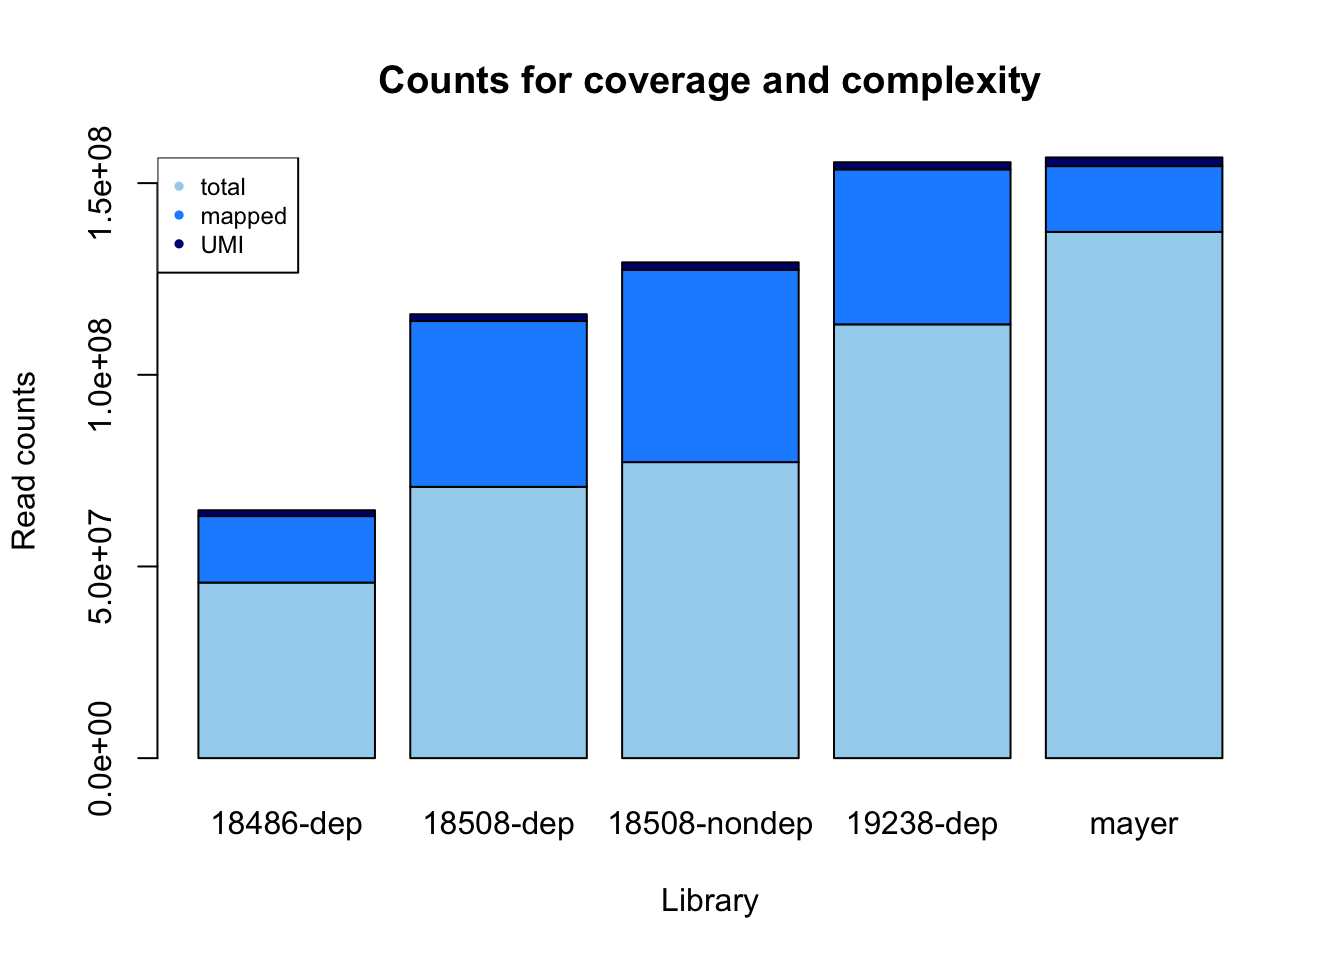
percent_mapped= sorted/fastq
percent_UMI= dedup/fastq
percent_not_mapped= 1- percent_mapped - percent_UMI

prop=rbind(percent_not_mapped, percent_mapped, percent_UMI)
colnames(prop)= library
prop_plot=barplot(as.matrix(prop), main="Proportions for coverage and complexity",
  xlab="Library", col=c("lightskyblue2","dodgerblue1","navy"),
    ylab="Proportion of sequenced reads")
legend("bottomright", legend = c("Un-mapped", "mapped", "UMI"), col=c("lightskyblue2","dodgerblue1","navy"), pch=20, cex = 0.75)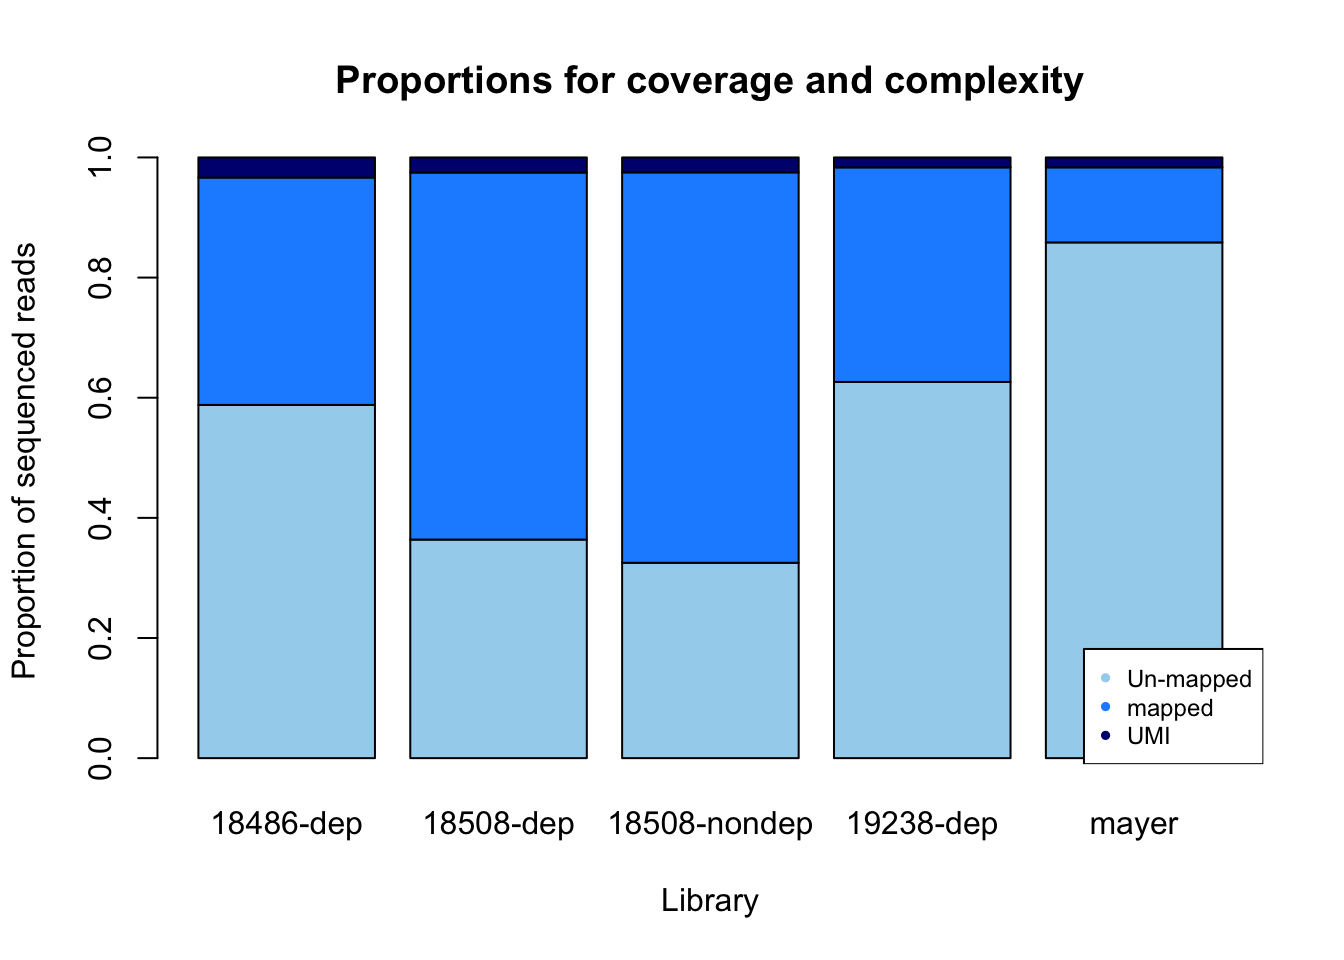
Undetermined is nothing: it corresponds to random reads
From meeting:
Allign with star and bwa to compare
compare to http://genome.ucsc.edu/cgi-bin/hgTracks?db=hg19&lastVirtModeType=default&lastVirtModeExtraState=&virtModeType=default&virtMode=0&nonVirtPosition=&position=chr7%3A5568588%2D5568715&hgsid=642260271_FLEwDANY0lSWCFhW4QjbmbASDDnB
Explore different mappers
#index and prepare ref genome:

STAR --runThreadN 2 --runMode genomeGenerate --genomeDir /scratch/midway2/brimittleman/star_genome/ --genomeFastaFiles  /project2/gilad/briana/Net-seq/STAR_genome/hg19.fa  --sjdbGTFfile /project2/gilad/briana/Net-seq/Homo_sapiens.GRCh37.75.chr.gtf --sjdbOverhang 43

# --sjdbOverhang read length -1


STAR --runThreadN 4 --genomeDir /scratch/midway2/brimittleman/star_genome/ --readFilesIn fastq_extr/SRR1575922_extracted.fastq --outFilterMultimapNmax 1 --outSAMtype BAM SortedByCoordinate --outStd BAM_SortedByCoordinate > star/mayer_star_align.bam
samtools sort -o star.sort/star_mayer.sort.bam star/mayer_star_align.bam
Run this on my data as well.
#!/bin/bash

#SBATCH --job-name=star_align_mayer
#SBATCH --time=8:00:00
#SBATCH --partition=broadwl
#SBATCH --mem=50G
#SBATCH --tasks-per-node=4


module load Anaconda3
source activate net-seq

STAR --runThreadN 4 --genomeDir /scratch/midway2/brimittleman/star_genome/ --readFilesIn fastq_extr/YG-SP-NET1-18486-dep-2017-10-13_S4_R1_001_extracted.fastq  --outFilterMultimapNmax 1 --outSAMtype BAM SortedByCoordinate --outStd BAM_SortedByCoordinate > star/star_18486-dep.bam

#to run: sbatch --partition=broadwl --mem=50G
Continue with the sort and index the bam.
samtools sort -o star.sort/star_18486_dep_sort.bam  star/star_18486-dep.bam
samtools index star_18486_dep_sort.bam
Look at the percent mapped with star.
samples=c("18486_dep", "mayer")
fastq_star= c(45803834,137281933)
bam_star= c(1996777,1993674)
bam_star/fastq_star
[1] 0.04359410 0.01452248Thats way too low. This didnt work.
In the log.Final file.
% of reads unmapped: too many mismatches | 0.00%
% of reads unmapped: too short | 79.96%
% of reads unmapped: other | 0.00%
“–outFilterScoreMinOverLread 0 –outFilterMatchNminOverLread 0 –outFilterMatchNmin 0” Try to add these parameters on the mayer map.
This run gave too many multi-map reads. 64.82%.
Try:
“–outFilterScoreMinOverLread 0.3 –outFilterMatchNminOverLread 0.3”
% of reads mapped to too many loci | 63.75%
Test length of fastq reads:
Mayer: total 137281933 avg=70.000000 stddev=0.000000 18486_dep: total 45803834 avg=44.000000 stddev=0.000000
Try clipping last 10 bases with : “–clip3pNbases 10”
* This didnt work for the mayer data but that is long. I will try it on ours.
Our data:
- % of reads mapped to too many loci | 31.70%
- % of reads unmapped: too short | 55.32%
Other ways to fix this:
- try blasting the unmapped reads
Look into BWA mapping
BWA-backtrack - for Illumina seqs up to 100 bp
First step is to construt a FM-index for the reference genome.
“bwa index -a bwtsw -p /scratch/midway2/brimittleman/BWA_genome/BWA.index STAR_genome/hg19.fa”
Added bwa to envirnoment
Mapping:
bwa aln
creates the .sai index files
-n 0.01 1% missmatch allowed
-t 3 spead up by using 3 threads
bwa samse
- generates alignments in a sam format
#$1 ref fa
#$2 fastq
#$3 output sai


module load Anaconda3
source activate net-seq
module load bwa

bwa aln -t 3 -n 0.01 $1 $2 > $3


#submit
sbatch scripts/bwa_aln.sh hg19.copy.fa /project2/gilad/briana/Net-seq/Net-seq1/data/fastq_extr/YG-SP-NET1-18486-dep-2017-10-13_S4_R1_001_extracted.fastq /project2/gilad/briana/Net-seq/Net-seq1/data/BWA/bwa.18486.dep.sai
#SBATCH --job-name=BWA_samse
#SBATCH --time=8:00:00
#SBATCH --partition=broadwl
#SBATCH --mem=50G
#SBATCH --tasks-per-node=4
#SBATCH --mail-type=END

#$1 ref fasta
#$2 sai file
#$3 fastq file
#$4 output sam


module load Anaconda3
source activate net-seq
module load bwa

bwa samse $1 $2 $3 > $4


#run on mayer
sbatch scripts/bwa_samse.sh hg19.copy.fa /project2/gilad/briana/Net-seq/data/bwa/bwa.mayer.sai /project2/gilad/briana/Net-seq/data/fastq_extr/SRR1575922_extracted.fastq  /project2/gilad/briana/Net-seq/data/bwa/bwa.mayer.sam


sbatch scripts/bwa_samse.sh hg19.copy.fa /project2/gilad/briana/Net-seq/data/bwa/bwa.mayer.cut3prime.sai  /project2/gilad/briana/Net-seq/data/fastq_extr/SRR1575922_extracted.fastq  /project2/gilad/briana/Net-seq/data/bwa/bwa.mayer.cut3prime.sam


#run on 18486 dep
sbatch scripts/bwa_samse.sh hg19.copy.fa /project2/gilad/briana/Net-seq/Net-seq1/data/BWA/bwa.18486.dep.sai /project2/gilad/briana/Net-seq/Net-seq1/data/fastq_extr/YG-SP-NET1-18486-dep-2017-10-13_S4_R1_001_extracted.fastq  /project2/gilad/briana/Net-seq/Net-seq1/data/BWA/bwa.18486.dep.sam
Sam to bam:
samtools view -S -b sample.sam > sample.bam
Check how big the file is:
- 18486_dep : 796546
- Mayer: 117726
This is super low mapping as well. Not sure what is going on.
For poor quality on the ends- add -q 15 to the bwa aln command. I am trying this on the mayer data.
- 18486_dep : 805899
- Mayer: 121892
Rerun star:
I deleted the reference genome and am reindexing and rebuilding it.
Cut polyA
Code from Sebs snakemake will allow me to cut any read that has more than 6 As. It will then keep the read if it is longer than 25 bases long post cut. I will run this on the UMI extracted fastq files.
This script is called cut_polyA.sh and is in the /project2/gilad/briana/Net-seq/scripts directory.
#!/bin/bash

#SBATCH --job-name=cut_polyA
#SBATCH --time=8:00:00
#SBATCH --partition=broadwl
#SBATCH --mem=8G
#SBATCH --tasks-per-node=4
#SBATCH --mail-type=END

module load Anaconda3
source activate net-seq

#$1 fastq file
#$2 output cut file name

cutadapt --minimum-length 25 -a AAAAAA -o $2 $1
Run this script first on 18486 dep.
sbatch scripts/cut_polyA.sh /project2/gilad/briana/Net-seq/Net-seq1/data/fastq_extr/YG-SP-NET1-18486-dep-2017-10-13_S4_R1_001_extracted.fastq /project2/gilad/briana/Net-seq/Net-seq1/data/cut_polyA/YG-SP-NET1-18486-dep-2017-10-13_S4_R1_001_extracted.cutPolyA.fastq
Pre-cut: 45803834
Cut: 40905492
sbatch scripts/star_allign.sh /project2/gilad/briana/Net-seq/Net-seq1/data/cut_polyA/YG-SP-NET1-18486-dep-2017-10-13_S4_R1_001_extracted.cutPolyA.fastq /project2/gilad/briana/Net-seq/Net-seq1/data/star/star_18486-dep_cutPolyA.bamCut: 40905492
mapped: 1350684
Subjunc with –allJunctions
I am running subjunc on the polyA cut reads with the –allJunctions to map cononincal and non-connoical exon exon boundaries.
This script is called subjunc_all_junc.sh and is in the /project2/gilad/briana/Net-seq/scripts directory.
#!/bin/bash

#SBATCH --job-name=cut_polyA
#SBATCH --time=8:00:00
#SBATCH --partition=broadwl
#SBATCH --mem=20G
#SBATCH --tasks-per-node=4
#SBATCH --mail-type=END

module load Anaconda3
source activate net-seq

#$1 input extracted fast q
#$2 output bam


subjunc --allJunctions -i /project2/gilad/briana/Net-seq/Net-seq1/genome/ -r $1 -T 8 > $2
#slurm-40290339.out
sbatch scripts/subjunc_all_junc.sh /project2/gilad/briana/Net-seq/Net-seq1/data/cut_polyA/YG-SP-NET1-18486-dep-2017-10-13_S4_R1_001_extracted.cutPolyA.fastq /project2/gilad/briana/Net-seq/Net-seq1/data/subjunc_all_junc/YG-SP-NET1-18486-dep-2017-10-13_S4_R1_001_extracted.cutPolyA.all.junc.bam
Before subjunc mapped 37.85. Now it mapped 38.4%.
I am also going to run this on the non polyA cut samples.
#slurm-40290637.out

sbatch scripts/subjunc_all_junc.sh /project2/gilad/briana/Net-seq/Net-seq1/data/fastq_extr/YG-SP-NET1-18486-dep-2017-10-13_S4_R1_001_extracted.fastq /project2/gilad/briana/Net-seq/Net-seq1/data/subjunc_all_junc/YG-SP-NET1-18486-dep-2017-10-13_S4_R1_001_extracted.all.junc.bam
Before subjunc mapped 37.85. This run is 53.1%
Try for mayer:
sbatch scripts/subjunc_all_junc.sh /project2/gilad/briana/Net-seq/data/fastq_extr/SRR1575922_extracted.fastq /project2/gilad/briana/Net-seq/data/subjunc_all_junc/mayer.extracted.subjunc.all.junc.bam

#508 dep
sbatch scripts/subjunc_all_junc.sh /project2/gilad/briana/Net-seq/Net-seq1/data/fastq_extr/YG-SP-NET1-18508-dep-2017-10-13_S2_R1_001_extracted.fastq /project2/gilad/briana/Net-seq/Net-seq1/data/subjunc_all_junc/YG-SP-NET1-18508-dep-2017-10-13_S2_R1_001_extracted.all.junc.bam
508_dep
dep fastq: 70776230
mapped: 54088856
This mapped 76.4%
samtools sort -o {output} {input}
samtools index {input}
umi_tools dedup -I {input.bam} -S {output}
Extend Mayer data exploration
I downloaded HeLa S3 Rep1 and the other run for HEK293T Rep1. I ran the snake file in the mayer.data directory as Mayer_hek and Mayer_hela.
mayer_hek
reads: 358754064
mapped: 128152521
deduplication: 4392741
mayer_hela
reads: 175303176
mapped: 51362897
deduplication: 6314281
m_fastq= c(358754064,175303176)
m_sort= c(128152521 , 51362897)
m_dedup= c(4392741, 6314281 )
mayer= c("Hek", "Hela")
counts_m= rbind(m_fastq, m_sort, m_dedup)
colnames(counts_m)= mayer
count_plot_m=barplot(as.matrix(counts_m), main="Counts for coverage and complexity",
  xlab="Library", col=c("lightskyblue2","dodgerblue1","navy"),
    ylab="Read counts")
legend("topright", legend = c("total", "mapped", "UMI"), col=c("lightskyblue2","dodgerblue1","navy"), pch=20, cex = .75)
percent_mapped_m= m_sort/m_fastq
percent_UMI_m= m_dedup/m_fastq
percent_not_mapped_m= 1- percent_mapped_m - percent_UMI_m

prop_m=rbind(percent_not_mapped_m, percent_mapped_m, percent_UMI_m)
colnames(prop_m)= mayer
prop_plot_m=barplot(as.matrix(prop_m), main="Proportions for coverage and complexity",
  xlab="Library", col=c("lightskyblue2","dodgerblue1","navy"),
    ylab="Proportion of sequenced reads")
legend("bottomright", legend = c("Un-mapped", "mapped", "UMI"), col=c("lightskyblue2","dodgerblue1","navy"), pch=20, cex = 0.75)
Session information
sessionInfo()R version 3.4.2 (2017-09-28)
Platform: x86_64-apple-darwin15.6.0 (64-bit)
Running under: macOS Sierra 10.12.6
Matrix products: default
BLAS: /Library/Frameworks/R.framework/Versions/3.4/Resources/lib/libRblas.0.dylib
LAPACK: /Library/Frameworks/R.framework/Versions/3.4/Resources/lib/libRlapack.dylib
locale:
[1] en_US.UTF-8/en_US.UTF-8/en_US.UTF-8/C/en_US.UTF-8/en_US.UTF-8
attached base packages:
[1] stats graphics grDevices utils datasets methods base
loaded via a namespace (and not attached):
[1] compiler_3.4.2 backports_1.1.1 magrittr_1.5 rprojroot_1.2
[5] tools_3.4.2 htmltools_0.3.6 yaml_2.1.14 Rcpp_0.12.13
[9] stringi_1.1.5 rmarkdown_1.6 knitr_1.17 git2r_0.19.0
[13] stringr_1.2.0 digest_0.6.12 evaluate_0.10.1This R Markdown site was created with workflowr