Compare to data from Lianogluo et al LCLse
Briana Mittleman
12/19/2018
Last updated: 2019-01-09
workflowr checks: (Click a bullet for more information)-
✔ R Markdown file: up-to-date
Great! Since the R Markdown file has been committed to the Git repository, you know the exact version of the code that produced these results.
-
✔ Environment: empty
Great job! The global environment was empty. Objects defined in the global environment can affect the analysis in your R Markdown file in unknown ways. For reproduciblity it’s best to always run the code in an empty environment.
-
✔ Seed:
set.seed(12345)The command
set.seed(12345)was run prior to running the code in the R Markdown file. Setting a seed ensures that any results that rely on randomness, e.g. subsampling or permutations, are reproducible. -
✔ Session information: recorded
Great job! Recording the operating system, R version, and package versions is critical for reproducibility.
-
Great! You are using Git for version control. Tracking code development and connecting the code version to the results is critical for reproducibility. The version displayed above was the version of the Git repository at the time these results were generated.✔ Repository version: f6ea825
Note that you need to be careful to ensure that all relevant files for the analysis have been committed to Git prior to generating the results (you can usewflow_publishorwflow_git_commit). workflowr only checks the R Markdown file, but you know if there are other scripts or data files that it depends on. Below is the status of the Git repository when the results were generated:
Note that any generated files, e.g. HTML, png, CSS, etc., are not included in this status report because it is ok for generated content to have uncommitted changes.Ignored files: Ignored: .DS_Store Ignored: .Rhistory Ignored: .Rproj.user/ Ignored: data/.DS_Store Ignored: output/.DS_Store Untracked files: Untracked: KalistoAbundance18486.txt Untracked: analysis/DirectionapaQTL.Rmd Untracked: analysis/ncbiRefSeq_sm.sort.mRNA.bed Untracked: analysis/snake.config.notes.Rmd Untracked: analysis/verifyBAM.Rmd Untracked: code/PeaksToCoverPerReads.py Untracked: code/strober_pc_pve_heatmap_func.R Untracked: data/18486.genecov.txt Untracked: data/APApeaksYL.total.inbrain.bed Untracked: data/ChromHmmOverlap/ Untracked: data/GM12878.chromHMM.bed Untracked: data/GM12878.chromHMM.txt Untracked: data/LianoglouLCL/ Untracked: data/LocusZoom/ Untracked: data/NuclearApaQTLs.txt Untracked: data/PeakCounts/ Untracked: data/PeaksUsed/ Untracked: data/RNAkalisto/ Untracked: data/TotalApaQTLs.txt Untracked: data/Totalpeaks_filtered_clean.bed Untracked: data/UnderstandPeaksQC/ Untracked: data/YL-SP-18486-T-combined-genecov.txt Untracked: data/YL-SP-18486-T_S9_R1_001-genecov.txt Untracked: data/apaExamp/ Untracked: data/bedgraph_peaks/ Untracked: data/bin200.5.T.nuccov.bed Untracked: data/bin200.Anuccov.bed Untracked: data/bin200.nuccov.bed Untracked: data/clean_peaks/ Untracked: data/comb_map_stats.csv Untracked: data/comb_map_stats.xlsx Untracked: data/comb_map_stats_39ind.csv Untracked: data/combined_reads_mapped_three_prime_seq.csv Untracked: data/diff_iso_trans/ Untracked: data/ensemble_to_genename.txt Untracked: data/example_gene_peakQuant/ Untracked: data/explainProtVar/ Untracked: data/filtered_APApeaks_merged_allchrom_refseqTrans.closest2End.bed Untracked: data/filtered_APApeaks_merged_allchrom_refseqTrans.closest2End.noties.bed Untracked: data/first50lines_closest.txt Untracked: data/gencov.test.csv Untracked: data/gencov.test.txt Untracked: data/gencov_zero.test.csv Untracked: data/gencov_zero.test.txt Untracked: data/gene_cov/ Untracked: data/joined Untracked: data/leafcutter/ Untracked: data/merged_combined_YL-SP-threeprimeseq.bg Untracked: data/mol_overlap/ Untracked: data/mol_pheno/ Untracked: data/nom_QTL/ Untracked: data/nom_QTL_opp/ Untracked: data/nom_QTL_trans/ Untracked: data/nuc6up/ Untracked: data/other_qtls/ Untracked: data/pQTL_otherphen/ Untracked: data/peakPerRefSeqGene/ Untracked: data/perm_QTL/ Untracked: data/perm_QTL_opp/ Untracked: data/perm_QTL_trans/ Untracked: data/perm_QTL_trans_filt/ Untracked: data/reads_mapped_three_prime_seq.csv Untracked: data/smash.cov.results.bed Untracked: data/smash.cov.results.csv Untracked: data/smash.cov.results.txt Untracked: data/smash_testregion/ Untracked: data/ssFC200.cov.bed Untracked: data/temp.file1 Untracked: data/temp.file2 Untracked: data/temp.gencov.test.txt Untracked: data/temp.gencov_zero.test.txt Untracked: data/threePrimeSeqMetaData.csv Untracked: output/picard/ Untracked: output/plots/ Untracked: output/qual.fig2.pdf Unstaged changes: Modified: analysis/28ind.peak.explore.Rmd Modified: analysis/InvestigatePeak2GeneAssignment.Rmd Modified: analysis/apaQTLoverlapGWAS.Rmd Modified: analysis/cleanupdtseq.internalpriming.Rmd Modified: analysis/coloc_apaQTLs_protQTLs.Rmd Modified: analysis/dif.iso.usage.leafcutter.Rmd Modified: analysis/diff_iso_pipeline.Rmd Modified: analysis/explainpQTLs.Rmd Modified: analysis/explore.filters.Rmd Modified: analysis/flash2mash.Rmd Modified: analysis/overlapMolQTL.Rmd Modified: analysis/overlap_qtls.Rmd Modified: analysis/peakOverlap_oppstrand.Rmd Modified: analysis/pheno.leaf.comb.Rmd Modified: analysis/swarmPlots_QTLs.Rmd Modified: analysis/test.max2.Rmd Modified: analysis/understandPeaks.Rmd Modified: code/Snakefile
Expand here to see past versions:
| File | Version | Author | Date | Message |
|---|---|---|---|---|
| Rmd | f6ea825 | Briana Mittleman | 2019-01-09 | add RNAseq dt code and cov by annotation plots |
| html | a6be7bd | Briana Mittleman | 2019-01-08 | Build site. |
| html | dfb2cb7 | Briana Mittleman | 2018-12-21 | Build site. |
| Rmd | 479293d | Briana Mittleman | 2018-12-21 | qtl res |
| html | 29e77fb | Briana Mittleman | 2018-12-21 | Build site. |
| Rmd | 490f857 | Briana Mittleman | 2018-12-21 | add QTL map code |
| html | 8d6e55e | Briana Mittleman | 2018-12-21 | Build site. |
| Rmd | 895acea | Briana Mittleman | 2018-12-21 | add QTL map code |
| html | b49ffd9 | Briana Mittleman | 2018-12-20 | Build site. |
| Rmd | 8925320 | Briana Mittleman | 2018-12-20 | filter annotated clusters |
| html | 785b821 | Briana Mittleman | 2018-12-20 | Build site. |
| Rmd | d99a6f3 | Briana Mittleman | 2018-12-20 | initializa comparison analysis |
The Lianoglou et al paper has data from LCLs as well. I am going to download their high confidence peaks from http://www.polyasite.unibas.ch
“In total, we collected 351,840 Poly(A) sites comprising a total of 4,394,848 reads. We calculated 35.20% of the poly(A) sites, which are 2.68% of all reads, to originate from internal priming.”
library(workflowr)This is workflowr version 1.1.1
Run ?workflowr for help getting startedlibrary(tidyverse)── Attaching packages ──────────────────────────────────────────────────── tidyverse 1.2.1 ──✔ ggplot2 3.0.0 ✔ purrr 0.2.5
✔ tibble 1.4.2 ✔ dplyr 0.7.6
✔ tidyr 0.8.1 ✔ stringr 1.3.1
✔ readr 1.1.1 ✔ forcats 0.3.0── Conflicts ─────────────────────────────────────────────────────── tidyverse_conflicts() ──
✖ dplyr::filter() masks stats::filter()
✖ dplyr::lag() masks stats::lag()library(edgeR)Loading required package: limmalibrary(tximport)LianoglouLCL=read.table("../data/LianoglouLCL/SRR1005684.3pSites.highconfidence.ip.bed", stringsAsFactors = F, col.names =c("chr", "start", "end", "Status", "Score", "Strand")) LianoglouLCL %>% group_by(Status) %>% tally()# A tibble: 3 x 2
Status n
<chr> <int>
1 IP 123864
2 OK 227975
3 <NA> 1Filter on the OK peaks.
LianoglouLCL_ok=LianoglouLCL %>% filter(Status=="OK")My reads in thier Peaks
I can map our reads to these peaks to see what percent of our reads map to these with feature counts. I will need to make this an SAF file.
LianoglouLCLBed2SAF.py
from misc_helper import *

fout = open("/project2/gilad/briana/threeprimeseq/data/LianoglouLCL/SRR1005684.3pSites.highconfidence.ip.OK.SAF",'w')
fout.write("GeneID\tChr\tStart\tEnd\tStrand\n")
for ln in open("/project2/gilad/briana/threeprimeseq/data/LianoglouLCL/SRR1005684.3pSites.highconfidence.ip.OK.bed"):
    chrom, start, end, name, score, strand = ln.split()
    chrom_F=chrom[3:]
    start_i=int(start)
    end_i=int(end)
    fout.write("%s\t%s\t%d\t%d\t%s\n"%(name, chrom_F, start_i, end_i, strand))
fout.close()
Feature Counts
LianoglouLCL_FC.sh
#!/bin/bash

#SBATCH --job-name=LianoglouLCL_FC
#SBATCH --account=pi-yangili1
#SBATCH --time=24:00:00
#SBATCH --output=LianoglouLCL_FC.out
#SBATCH --error=LianoglouLCL_FC.err
#SBATCH --partition=broadwl
#SBATCH --mem=12G
#SBATCH --mail-type=END

module load Anaconda3
source activate three-prime-env

featureCounts -O -a /project2/gilad/briana/threeprimeseq/data/LianoglouLCL/SRR1005684.3pSites.highconfidence.ip.OK.SAF -F SAF -o /project2/gilad/briana/threeprimeseq/data/LianoglouLCL/LianoglouLCL_CleanPeaks.Total.fc /project2/gilad/briana/threeprimeseq/data/sort/*-T-*-sort.bam -s 2

featureCounts -O -a /project2/gilad/briana/threeprimeseq/data/LianoglouLCL/SRR1005684.3pSites.highconfidence.ip.OK.SAF -F SAF -o /project2/gilad/briana/threeprimeseq/data/LianoglouLCL/LianoglouLCL_CleanPeaks.Nuclear.fc /project2/gilad/briana/threeprimeseq/data/sort/*-N-*-sort.bam -s 2
fix_LianoglouLCL_FC.py
infile= open("/project2/gilad/briana/threeprimeseq/data/LianoglouLCL/LianoglouLCL_CleanPeaks.Total.fc.summary", "r")
fout = open("/project2/gilad/briana/threeprimeseq/data/LianoglouLCL/LianoglouLCL_CleanPeaks.Total.fc_fixed.summary",'w')
for line, i in enumerate(infile):
    if line == 0:
        i_list=i.split()
        libraries=[i_list[0]]
        for sample in i_list[1:]:
            full = sample.split("/")[7]
            samp= full.split("-")[2:4]
            lim="_"
            samp_st=lim.join(samp)
            libraries.append(samp_st)
        print(libraries)
        first_line= "\t".join(libraries)
        fout.write(first_line + '\n' )
    else:
        fout.write(i)
fout.close()
Pull summary onto computer and explore percent of reads mapping to peaks.
Peak Overlap
I can also ask how many of our peaks overlap with theirs.
sed 's/^chr//' /project2/gilad/briana/threeprimeseq/data/LianoglouLCL/SRR1005684.3pSites.highconfidence.ip.OK.bed > /project2/gilad/briana/threeprimeseq/data/LianoglouLCL/SRR1005684.3pSites.highconfidence.ip.OK_noCHR.bed

#sort

sort -k 1,1 -k2,2n /project2/gilad/briana/threeprimeseq/data/LianoglouLCL/SRR1005684.3pSites.highconfidence.ip.OK_noCHR.bed > /project2/gilad/briana/threeprimeseq/data/LianoglouLCL/SRR1005684.3pSites.highconfidence.ip.OK_noCHR_sort.bed
Remake file in python:
inFile=open("/project2/gilad/briana/threeprimeseq/data/LianoglouLCL/SRR1005684.3pSites.highconfidence.ip.OK_noCHR_sort.bed", "r")
outFile=open("/project2/gilad/briana/threeprimeseq/data/LianoglouLCL/SRR1005684.3pSites.highconfidence.ip.OK_noCHR_sort_fixed.bed", "w")
for ln in inFile:
  chrom, start, end, stat, score, strand = ln.split()
  start_i=int(start)
  end_i=int(end)
  outFile.write("%s\t%d\t%d\t%s\t%s\t%s\n"%(chrom, start_i, end_i, stat, score, strand))
outFile.close()
import pybedtools
lian=pybedtools.BedTool("/project2/gilad/briana/threeprimeseq/data/LianoglouLCL/SRR1005684.3pSites.highconfidence.ip.OK_noCHR_sort_fixed.bed")
Peak=pybedtools.BedTool("/project2/gilad/briana/threeprimeseq/data/mergedPeaks_comb/filtered_APApeaks_merged_allchrom_refseqTrans.noties_sm.fixed.bed")

lianOverPeak=Peak.intersect(lian, u=True)

#this only results in one overlap:
lianOverPeak.saveas("/project2/gilad/briana/threeprimeseq/data/LianoglouLCL/myPeaksInLiangoluLCL.bed")
This results in 39213 peaks.
I will look at our peaks, thier peaks and our tracks in IGV.
Next I can look at the peaks that are called at IP in the Lianglou data.
sed 's/^chr//' /project2/gilad/briana/threeprimeseq/data/LianoglouLCL/SRR1005684.3pSites.highconfidence.ipOnly.bed > /project2/gilad/briana/threeprimeseq/data/LianoglouLCL/SRR1005684.3pSites.highconfidence.ipOnly_noCHR.bed

#sort

sort -k 1,1 -k2,2n /project2/gilad/briana/threeprimeseq/data/LianoglouLCL/SRR1005684.3pSites.highconfidence.ipOnly_noCHR.bed > /project2/gilad/briana/threeprimeseq/data/LianoglouLCL/SRR1005684.3pSites.highconfidence.ipOnly_noCHR_sort.bed
Remake file in python:
inFile=open("/project2/gilad/briana/threeprimeseq/data/LianoglouLCL/SRR1005684.3pSites.highconfidence.ipOnly_noCHR_sort.bed", "r")
outFile=open("/project2/gilad/briana/threeprimeseq/data/LianoglouLCL/SRR1005684.3pSites.highconfidence.ipOnly_noCHR_sort_fixed.bed", "w")
for ln in inFile:
  chrom, start, end, stat, score, strand = ln.split()
  start_i=int(start)
  end_i=int(end)
  outFile.write("%s\t%d\t%d\t%s\t%s\t%s\n"%(chrom, start_i, end_i, stat, score, strand))
outFile.close()
import pybedtools
lian=pybedtools.BedTool("/project2/gilad/briana/threeprimeseq/data/LianoglouLCL/SRR1005684.3pSites.highconfidence.ipOnly_noCHR_sort_fixed.bed")
Peak=pybedtools.BedTool("/project2/gilad/briana/threeprimeseq/data/mergedPeaks_comb/filtered_APApeaks_merged_allchrom_refseqTrans.noties_sm.fixed.bed")

lianOverPeak=Peak.intersect(lian, u=True)

#this only results in one overlap:
lianOverPeak.saveas("/project2/gilad/briana/threeprimeseq/data/LianoglouLCL/myPeaksInLiangoluLCL_IPOnly.bed")
This results in 35700 peaks.
Our peaks are wider and may incompase the ok and IP peaks. Some of these overlap. I will look at how many.
I can ask how many of the OK peaks in our data are also in the IP list of our peaks
import pybedtools
ip=pybedtools.BedTool("/project2/gilad/briana/threeprimeseq/data/LianoglouLCL/myPeaksInLiangoluLCL_IPOnly.bed")
ok=pybedtools.BedTool("/project2/gilad/briana/threeprimeseq/data/LianoglouLCL/myPeaksInLiangoluLCL.bed")

okoverip=ok.intersect(ip, u=True)

#this only results in one overlap:
okoverip.saveas("/project2/gilad/briana/threeprimeseq/data/LianoglouLCL/myPeaksInLiangoluLCL_OkandIP.bed")
This results in 16459 peaks.
One problem is thier peaks are only one base pair and we have peaks tat are 1 bp away, ex chr7:5,528,801-5,528,844.
I can expand thier peaks by 5bp on each side and see how much different the results are. I will do this first for the OK peaks only.
inFile=open("/project2/gilad/briana/threeprimeseq/data/LianoglouLCL/SRR1005684.3pSites.highconfidence.ip.OK_noCHR_sort_fixed.bed", "r")
outFile=open("/project2/gilad/briana/threeprimeseq/data/LianoglouLCL/SRR1005684.3pSites.highconfidence.ip.OK_noCHR_sort_fixed_EXTEND.bed", "w")
for ln in inFile:
  chrom, start, end, stat, score, strand = ln.split()
  start_i=int(start) - 5
  end_i=int(end) + 5
  outFile.write("%s\t%d\t%d\t%s\t%s\t%s\n"%(chrom, start_i, end_i, stat, score, strand))
outFile.close()


import pybedtools
lian=pybedtools.BedTool("/project2/gilad/briana/threeprimeseq/data/LianoglouLCL/SRR1005684.3pSites.highconfidence.ip.OK_noCHR_sort_fixed_EXTEND.bed")
Peak=pybedtools.BedTool("/project2/gilad/briana/threeprimeseq/data/mergedPeaks_comb/filtered_APApeaks_merged_allchrom_refseqTrans.noties_sm.fixed.bed")

lianOverPeak=Peak.intersect(lian, u=True)

#this only results in one overlap:
lianOverPeak.saveas("/project2/gilad/briana/threeprimeseq/data/LianoglouLCL/myPeaksInExtendedLiangoluLCL.bed")
No we have 227975 of our peaks out of 338141 overlapping. This is 67%
I want to do an analysis where I sperate the overlapping and non overlapping peaks (using thier OK peaks) and look at read distributions. To do this I will pull in the overlapping peaks and intersect them with my full peak data. I want to make a data frame with the peak, if it is in their ok list, and the sum coverage in my data (ill do this for total)
OverlapPeaks=read.table("../data/LianoglouLCL/myPeaksInExtendedLiangoluLCL.bed",stringsAsFactors = F, col.names = c("chr", "start", "end", "name", "score", "strand", "gene")) %>% mutate(peak=paste("peak", name, sep = ""))
overlapPeaklist=as.vector(OverlapPeaks$peak)
total_Cov=read.table("../data/PeakCounts/filtered_APApeaks_merged_allchrom_refseqGenes.Transcript_sm_quant.Total_fixed.fc", header=T, stringsAsFactors = F) %>% separate(Geneid, into=c("peak", "chrom", "start", "end", "strand", "gene"), sep=":") %>% mutate(inLian=ifelse(peak %in% overlapPeaklist, "Yes", "No"))

total_Cov_num=total_Cov[,12:50]
PeakSum=rowSums(total_Cov_num)

peakCovSum=as.data.frame(cbind(Annotated=total_Cov$inLian, PeakSum=PeakSum))
peakCovSum$Annotated=as.factor(peakCovSum$Annotated)
peakCovSum$PeakSum=as.numeric(as.character(peakCovSum$PeakSum))
Plot the data:
library(ggpubr)Loading required package: magrittr
Attaching package: 'magrittr'The following object is masked from 'package:purrr':
set_namesThe following object is masked from 'package:tidyr':
extractcovbyannoation=ggplot(peakCovSum, aes(x=Annotated, y=log10(PeakSum + 1), by=Annotated, fill=Annotated))+ geom_violin() + stat_compare_means(method = "t.test") + labs(title="Sum of peak read count by annotation status", x="In Lianoglou Annitation")
covbyannoation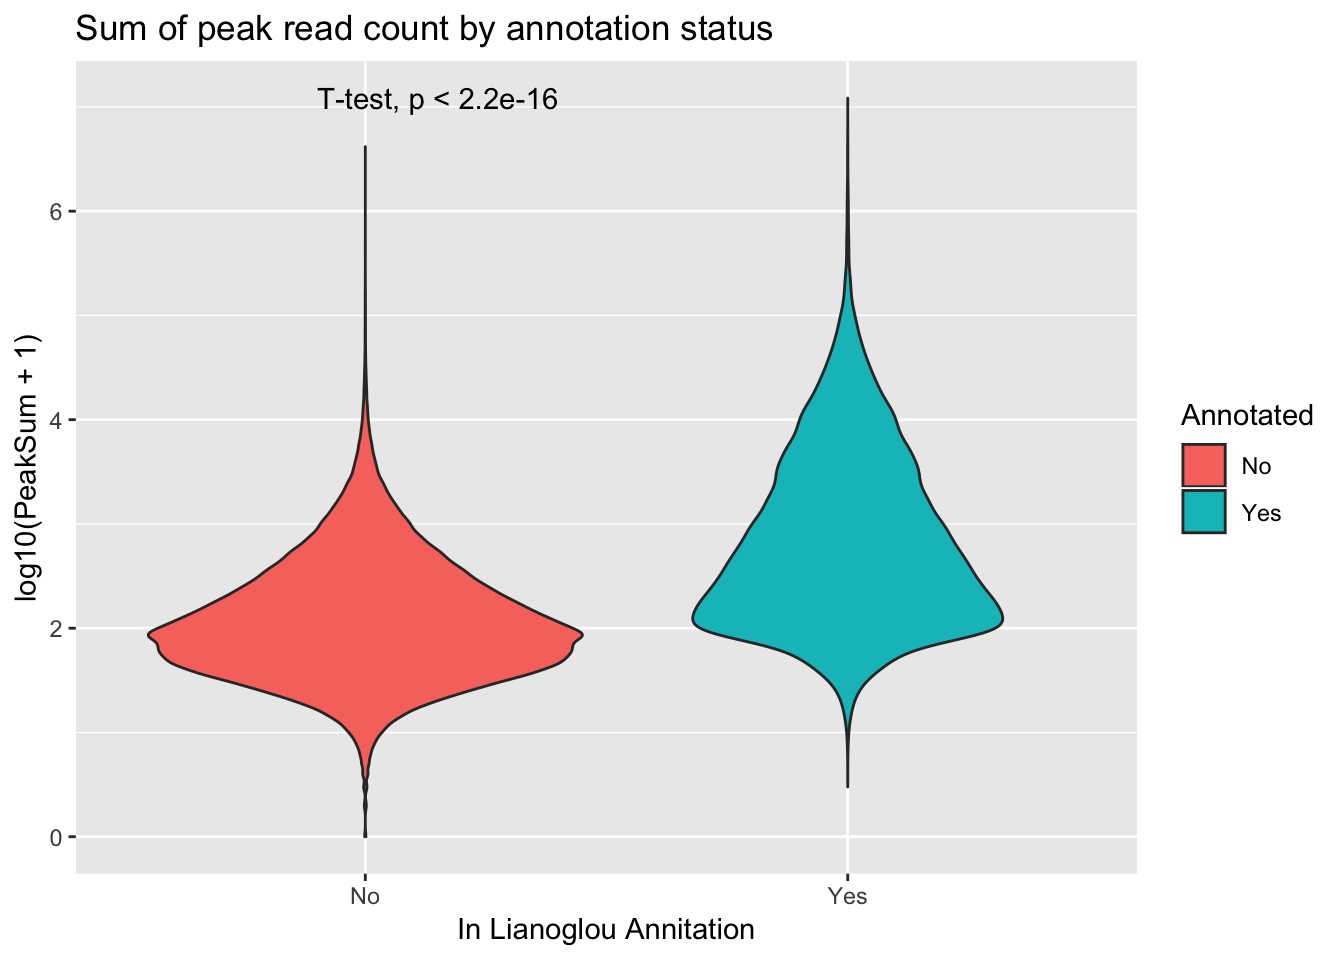
ggsave(file="../output/plots/PeakCoverageByAnnotationTotal.png", covbyannoation)Saving 7 x 5 in imageplot cdf stat_ecdf(geom = “point”)
ggplot(peakCovSum, aes(x=log10(PeakSum + 1), by=Annotated, col=Annotated))+ stat_ecdf(geom="point") + labs(title="Sum of peak read count by annotation status")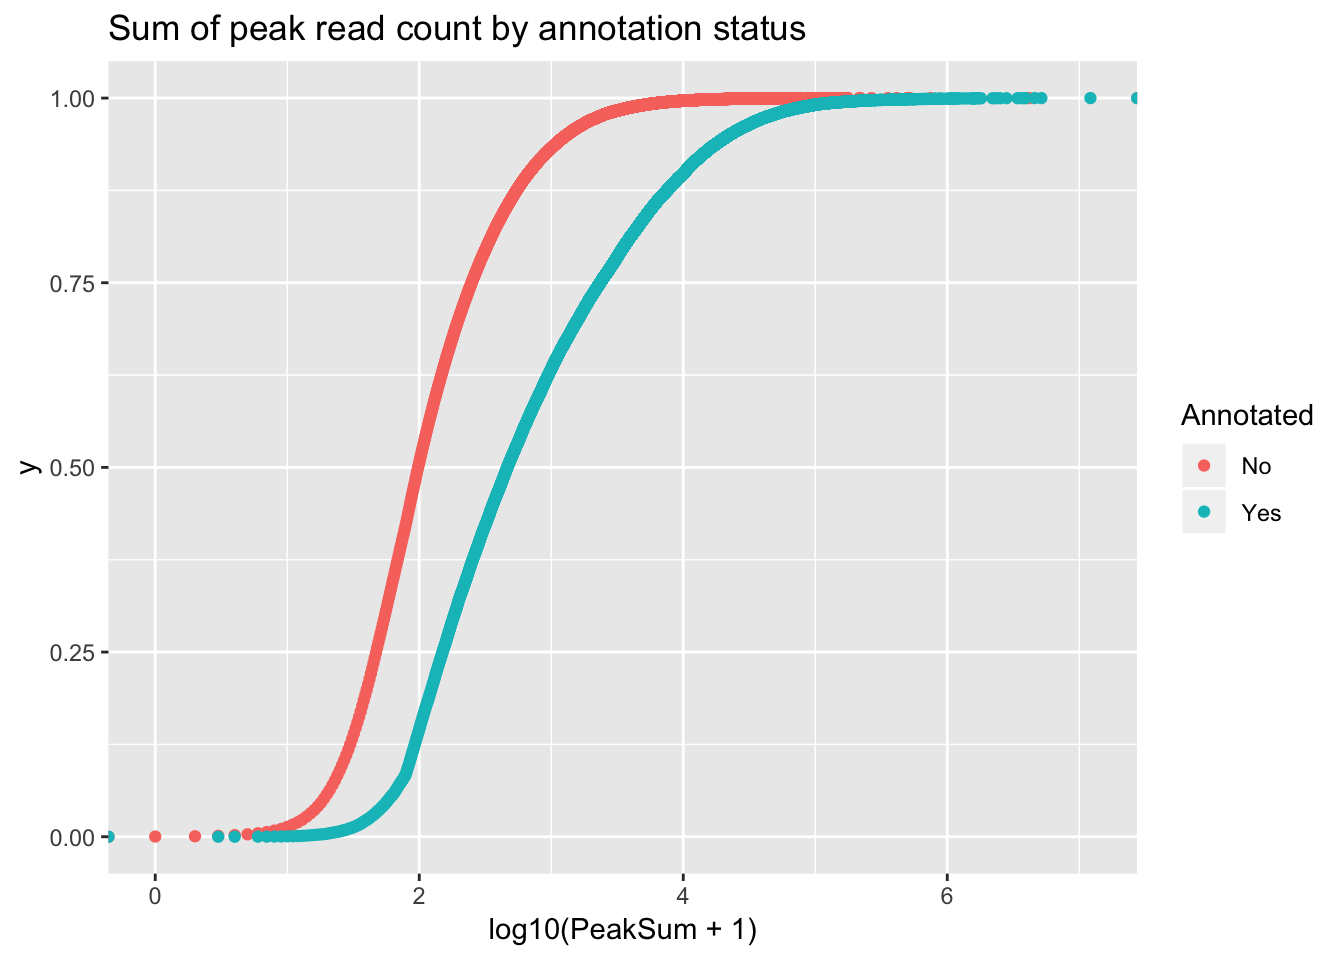
I will do this in nuclear. I expect results to be a bit difference because we expect some peaks not to be in the annotation.
nuc_Cov=read.table("../data/PeakCounts/filtered_APApeaks_merged_allchrom_refseqGenes.Transcript_sm_quant.Nuclear_fixed.fc", header=T, stringsAsFactors = F) %>% separate(Geneid, into=c("peak", "chrom", "start", "end", "strand", "gene"), sep=":") %>% mutate(inLian=ifelse(peak %in% overlapPeaklist, "Yes", "No"))

nuc_Cov_num=nuc_Cov[,12:50]
PeakSumNuc=rowSums(nuc_Cov_num)

peakCovSumNuc=as.data.frame(cbind(Annotated=nuc_Cov$inLian, PeakSum=PeakSumNuc))
peakCovSumNuc$Annotated=as.factor(peakCovSumNuc$Annotated)
peakCovSumNuc$PeakSum=as.numeric(as.character(peakCovSumNuc$PeakSum))
covbyannoationnuc=ggplot(peakCovSumNuc, aes(x=Annotated, y=log10(PeakSum + 1), by=Annotated, fill=Annotated))+ geom_violin() + stat_compare_means(method = "t.test") + labs(title="Sum of peak read count by annotation status- Nuclear", x="In Lianoglou Annitation")
covbyannoationnuc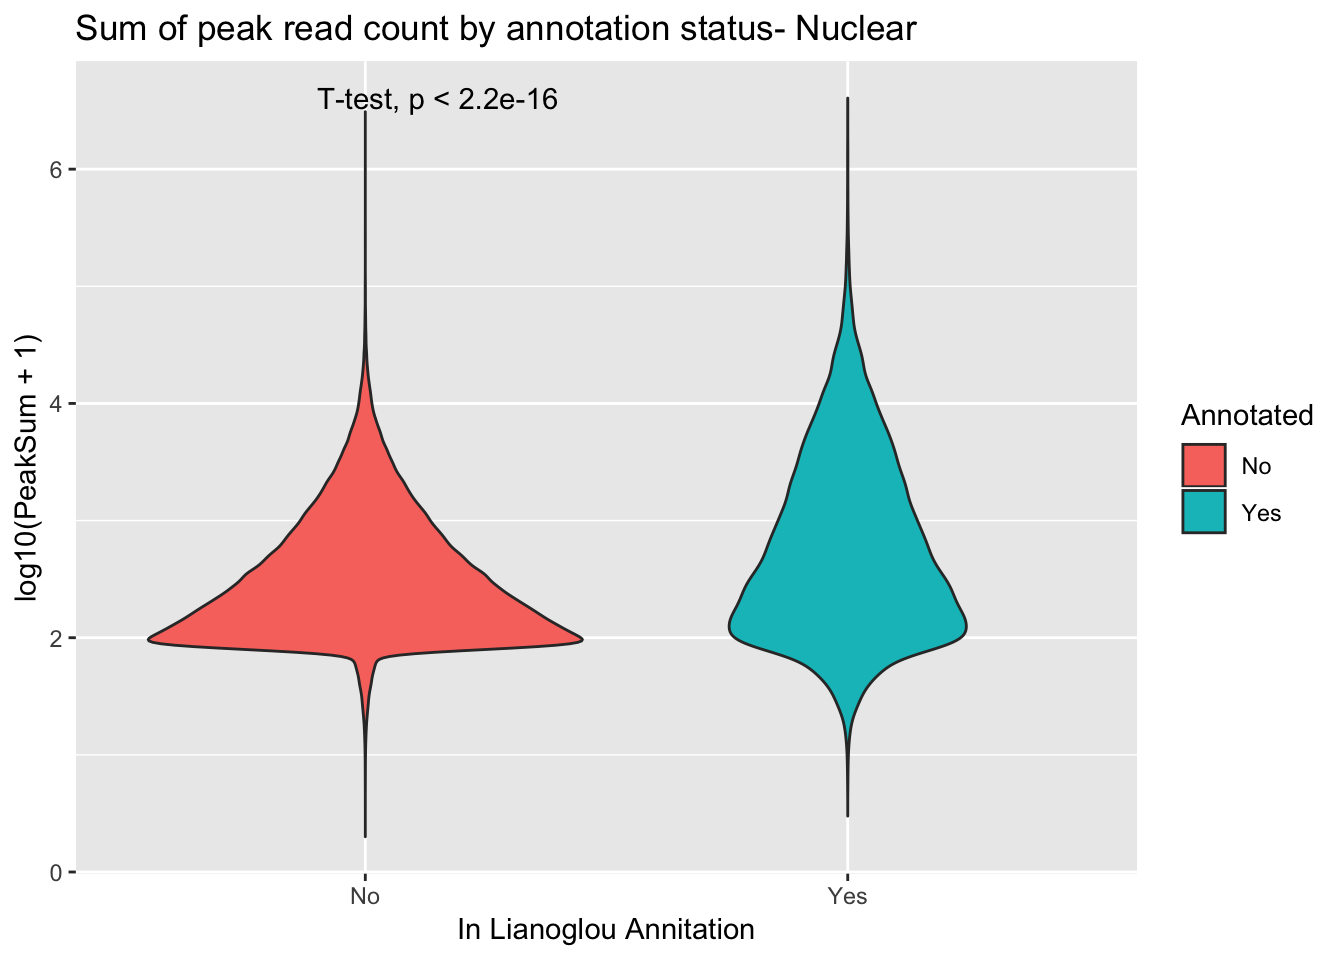
look at them next to eachother:
Change Annotations to full atlas
Quantify coverage at annotated clusters
The full atlas has peaks mapped to genes. (http://www.polyasite.unibas.ch) I will use these and map our data to them. I can then run the QC metrics I had done previously as well as the QTL analysis.
The first step will be processing the data into a format like mine with peakIDs including the gene name. Then I will run feature counts and filter the non used peaks.
Information from site about columns
The first column stores the chromosome name.
The second and the third column mark the start and end positions of poly(A) site cluster, respectively.
The fourth column is the unqiue cluster ID composed of the chromosome name, the strand, the representative poly(A) site of the cluster, and a two letter code for the cluster annotation (TE: terminal exon, DS: 1,000 nt downstream of a terminal exon, EX: exonic, IN: intronic, AU: 1,000 nt upstream in anti-sense direction of a transcription start site, AE: anti-sense to an exon, AI: anti-sense to an intron, IG: intergenic).
The fifth column stores the number different 3’ end sequencing protocols that support the particular cluster.
The sixth column stores the strand.
The seventh column stores information about the poly(A) signal(s) per poly(A) site, including the motif, the location with respect to the cleavage site and the genomic coordinate.
I am going to use clusters.bed
I am only going to keep PAS with an annotated gene. This is in column 8.
The goal is a dataset like /project2/gilad/briana/threeprimeseq/data/mergedPeaks_comb/filtered_APApeaks_merged_allchrom_refseqTrans.noties_sm.SAF for feature counts. I need to number the peaks here. To do this I can add a column with a number like I did for my peaks.
First sort the clusters file:
sort -k 1,1 -k2,2n /project2/gilad/briana/threeprimeseq/data/LianoglouLCL/clusters.bed > /project2/gilad/briana/threeprimeseq/data/LianoglouLCL/clusters_sort.bed

x = wc -l /project2/gilad/briana/threeprimeseq/data/LianoglouLCL/clusters_sort.bed

seq 1 392912 > cluster.peak.num.txt

paste /project2/gilad/briana/threeprimeseq/data/LianoglouLCL/clusters_sort.bed   cluster.peak.num.txt | column -s $'\t' -t > /project2/gilad/briana/threeprimeseq/data/LianoglouLCL/clusters_sort_named.bed
Python script to make a SAF.
clusterBed2SAF.py
fout = open("/project2/gilad/briana/threeprimeseq/data/LianoglouLCL/clusters_sort_named.SAF",'w')
fout.write("GeneID\tChr\tStart\tEnd\tStrand\n")
for ln in open("/project2/gilad/briana/threeprimeseq/data/LianoglouLCL/clusters_sort_named.bed"):
    chrom, start, end, uniq, score, strand, extra, gene, name = ln.split()
    if gene==".":
      continue
    else:
      chrom_o=chrom[3:]
      name_i=int(name)
      start_i=int(start)
      end_i=int(end)
      ID = "peak%d:%s:%d:%d:%s:%s"%(name_i, chrom_o, start_i, end_i, strand, gene)
      fout.write("%s\t%s\t%d\t%d\t%s\n"%(ID, chrom_o, start_i, end_i, strand))
fout.close()
I can now use this to run feature counts with my bam files.
AnnotatedClustersFC_TN.sh
#!/bin/bash

#SBATCH --job-name=AnnotatedClustersFC_TN
#SBATCH --account=pi-yangili1
#SBATCH --time=24:00:00
#SBATCH --output=AnnotatedClustersFC_TN.out
#SBATCH --error=AnnotatedClustersFC_TN.err
#SBATCH --partition=broadwl
#SBATCH --mem=12G
#SBATCH --mail-type=END

module load Anaconda3
source activate three-prime-env

featureCounts -O -a /project2/gilad/briana/threeprimeseq/data/LianoglouLCL/clusters_sort_named.SAF -F SAF -o /project2/gilad/briana/threeprimeseq/data/LianoglouLCL_quant/AnnotatedClusters.Total.fc /project2/gilad/briana/threeprimeseq/data/sort/*-T-*-sort.bam -s 2

featureCounts -O -a /project2/gilad/briana/threeprimeseq/data/LianoglouLCL/clusters_sort_named.SAF -F SAF -o /project2/gilad/briana/threeprimeseq/data/LianoglouLCL_quant/AnnotatedClusters.Nuclear.fc /project2/gilad/briana/threeprimeseq/data/sort/*-N-*-sort.bam -s 2
I will next need to fix the headers for the total and nuclear files.
FixHeader_TotalAnnotatedClustersFC.py
infile= open("/project2/gilad/briana/threeprimeseq/data/LianoglouLCL_quant/AnnotatedClusters.Total.fc", "r")
fout = open("/project2/gilad/briana/threeprimeseq/data/LianoglouLCL_quant/AnnotatedClusters.Total.fixed.fc",'w')
for line, i in enumerate(infile):
    if line == 1:
        i_list=i.split()
        libraries=i_list[:6]
        for sample in i_list[6:]:
            full = sample.split("/")[7]
            samp= full.split("-")[2:4]
            lim="_"
            samp_st=lim.join(samp)
            libraries.append(samp_st)
        first_line= "\t".join(libraries)
        fout.write(first_line + '\n')
    else :
        fout.write(i)
fout.close()
FixHeader_NucelarAnnotatedClustersFC.py
infile= open("/project2/gilad/briana/threeprimeseq/data/LianoglouLCL_quant/AnnotatedClusters.Nuclear.fc", "r")
fout = open("/project2/gilad/briana/threeprimeseq/data/LianoglouLCL_quant/AnnotatedClusters.Nuclear.fixed.fc",'w')
for line, i in enumerate(infile):
    if line == 1:
        i_list=i.split()
        libraries=i_list[:6]
        for sample in i_list[6:]:
            full = sample.split("/")[7]
            samp= full.split("-")[2:4]
            lim="_"
            samp_st=lim.join(samp)
            libraries.append(samp_st)
        first_line= "\t".join(libraries)
        fout.write(first_line + '\n')
    else :
        fout.write(i)
fout.close()
This results in 7-11 million reads mapping to the features in the total fraction. This is in comparison to over 10 mill in our peaks.
Look at total coverage
With these results I need to filter the lowley expressed clusters. I will start with one line as I did before.
total_Cov=read.table("../data/LianoglouLCL/AnnotatedClusters.Total.fixed.fc", header=T, stringsAsFactors = F)

peakLength=total_Cov[,6]


total_Cov_m= as.matrix(total_Cov[,7:ncol(total_Cov)])
total_Cov_m=log10(total_Cov_m)
Plot the densities
plotDensities(total_Cov_m, legend = "bottomright", main="Pre-filtering")
abline(v = .5, lty = 3)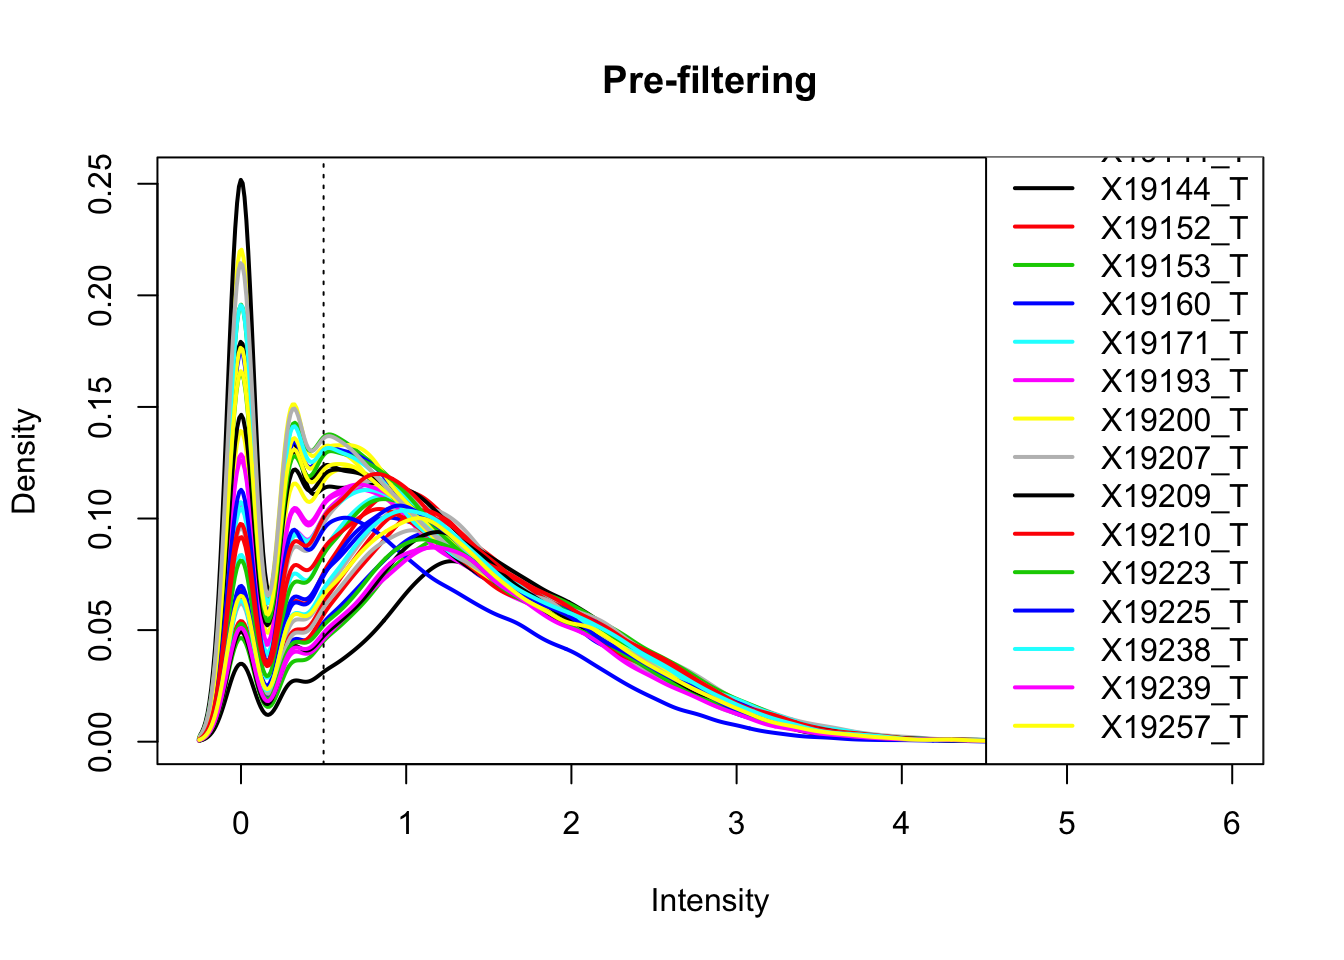
Expand here to see past versions of unnamed-chunk-28-1.png:
| Version | Author | Date |
|---|---|---|
| 8d6e55e | Briana Mittleman | 2018-12-21 |
The cuttoff should be log10=.5. I want to filter on this.
keep.exprs_T=rowSums(total_Cov_m>.5) >= 26
total_Cov_m_filt= total_Cov_m[keep.exprs_T,]

plotDensities(total_Cov_m_filt, legend = "bottomright", main="Post-filtering")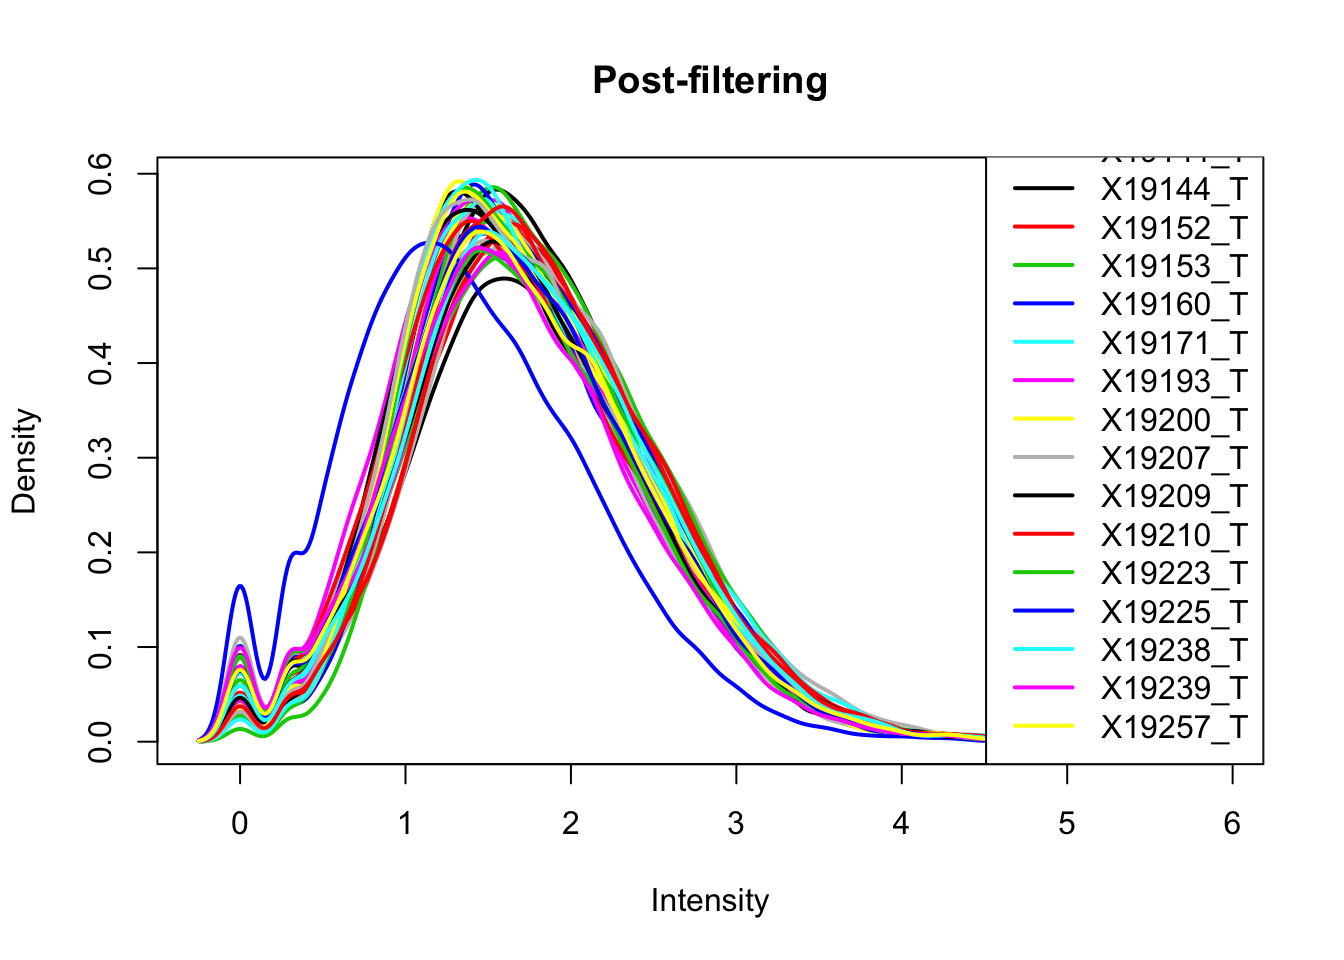
Expand here to see past versions of unnamed-chunk-29-1.png:
| Version | Author | Date |
|---|---|---|
| 8d6e55e | Briana Mittleman | 2018-12-21 |
This looks a lot better and results in 35,197 peaks. Now I can filter the full dataframe and start comparing this to the RNA seq.
total_Cov_18486_filt=total_Cov[keep.exprs_T,1:7] %>% separate(Geneid, into=c("peak", "chr", "start", "end", "strand", "gene"), sep=":") %>% select(gene, X18486_T)%>% group_by(gene) %>% summarize(GeneSum=sum(X18486_T))Pull in the kalisto counts.
TPM counts from Kalisto
tx2gene=read.table("../data/RNAkalisto/ncbiRefSeq.txn2gene.txt" ,header= F, sep="\t", stringsAsFactors = F)

txi.kallisto.tsv <- tximport("../data/RNAkalisto/abundance.tsv", type = "kallisto", tx2gene = tx2gene,countsFromAbundance="lengthScaledTPM" )
Note: importing `abundance.h5` is typically faster than `abundance.tsv`reading in files with read_tsv1
removing duplicated transcript rows from tx2gene
transcripts missing from tx2gene: 99
summarizing abundance
summarizing counts
summarizing lengthJoin the data frames.
TXN_abund=as.data.frame(txi.kallisto.tsv$abundance) %>% rownames_to_column(var="gene")
colnames(TXN_abund)=c("gene", "TPM")

Overlap=TXN_abund %>% inner_join(total_Cov_18486_filt,by="gene")
Remove rows with 0 counts and Plot:
Overlap=Overlap %>% filter(TPM>0) %>% filter(GeneSum>0)
corr_18486Tot=ggplot(Overlap, aes(x=log10(TPM), y= log10(GeneSum))) + geom_point() + labs(title="Total 18486 with Annotated Peaks", x="log10 RNA seq TPM", y="log10 Peak count sum per gene")+ geom_smooth(aes(x=log10(TPM),y=log10(GeneSum)),method = "lm") + annotate("text",x=-5, y=5,label="R2=.47") +geom_density2d(na.rm = TRUE, size = 1, colour = 'red')

#+ geom_text(aes(label=gene),hjust=0, vjust=0)

corr_18486Tot 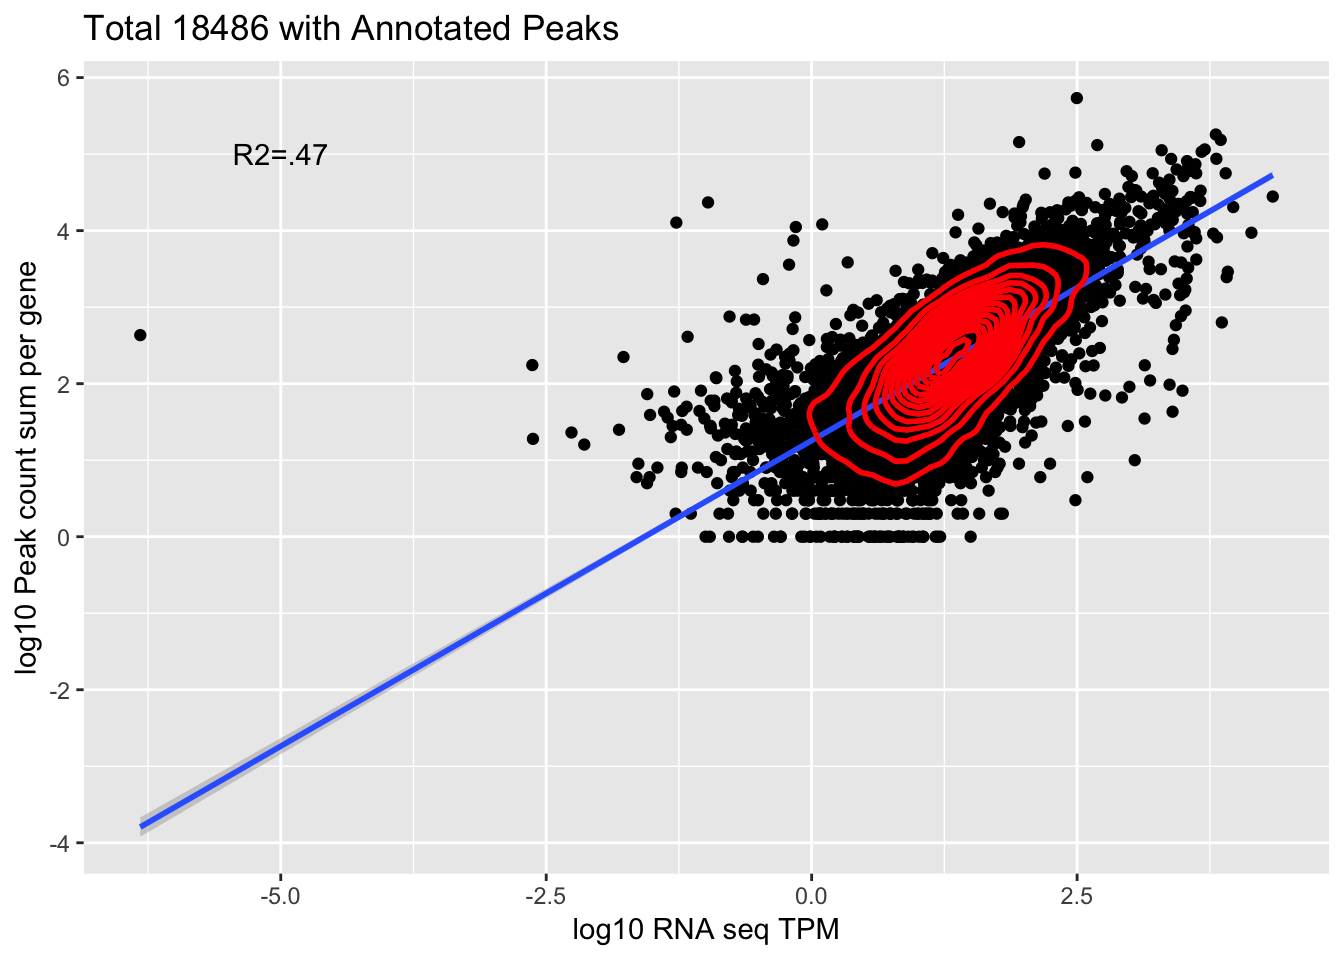
summary(lm(log10(TPM)~log10(GeneSum),Overlap))
Call:
lm(formula = log10(TPM) ~ log10(GeneSum), data = Overlap)

Residuals:
    Min      1Q  Median      3Q     Max
-7.8184 -0.2344  0.0135  0.2620  2.5192

Coefficients:
                Estimate Std. Error t value Pr(>|t|)
(Intercept)    -0.070619   0.015141  -4.664 3.14e-06 ***
log10(GeneSum)  0.594440   0.006294  94.449  < 2e-16 ***
---
Signif. codes:  0 '***' 0.001 '**' 0.01 '*' 0.05 '.' 0.1 ' ' 1

Residual standard error: 0.4692 on 9865 degrees of freedom
Multiple R-squared:  0.4749,    Adjusted R-squared:  0.4748
F-statistic:  8921 on 1 and 9865 DF,  p-value: < 2.2e-16
cor.test(log10(Overlap$TPM),log10(Overlap$GeneSum))
    Pearson's product-moment correlation

data:  log10(Overlap$TPM) and log10(Overlap$GeneSum)
t = 94.449, df = 9865, p-value < 2.2e-16
alternative hypothesis: true correlation is not equal to 0
95 percent confidence interval:
 0.6785988 0.6993264
sample estimates:
      cor
0.6891035
This is looking at 9,867 genes.
Look at this sum overed all individuals.
TotCounts_allind=total_Cov[keep.exprs_T,7:45]


SumCounts_Tot=rowSums(TotCounts_allind)

Alllib_Tot_Filt=total_Cov[keep.exprs_T,1:7] %>% separate(Geneid, into=c("peak", "chr", "start", "end", "strand", "gene"), sep=":")


Alllib_Tot_Filt$SumCounts=SumCounts_Tot

Alllib_Tot_Filtbygene=Alllib_Tot_Filt %>% select(gene, SumCounts) %>%  group_by(gene)  %>%  summarize(GeneSum=sum(SumCounts))


TXN_abund_combLibs_tot=TXN_abund %>% inner_join(Alllib_Tot_Filtbygene,by="gene")


TXN_abund_combLibs_tot_n0=TXN_abund_combLibs_tot %>% filter(TPM>0) %>% filter(GeneSum>0)


corr_AllLibTot=ggplot(TXN_abund_combLibs_tot_n0, aes(x=log10(TPM), y= log10(GeneSum))) + geom_point() + labs(title="Total All ind Filtered Annotated Clusters", x="log10 RNA seq TPM", y="log10 Peak count sum per gene All Ind.")+ geom_smooth(aes(x=log10(TPM),y=log10(GeneSum)),method = "lm") + annotate("text",x=-5, y=5,label="R2=.53") +geom_density2d(na.rm = TRUE, size = 1, colour = 'red') + geom_text(aes(label=gene),hjust=0, vjust=0)

corr_AllLibTot 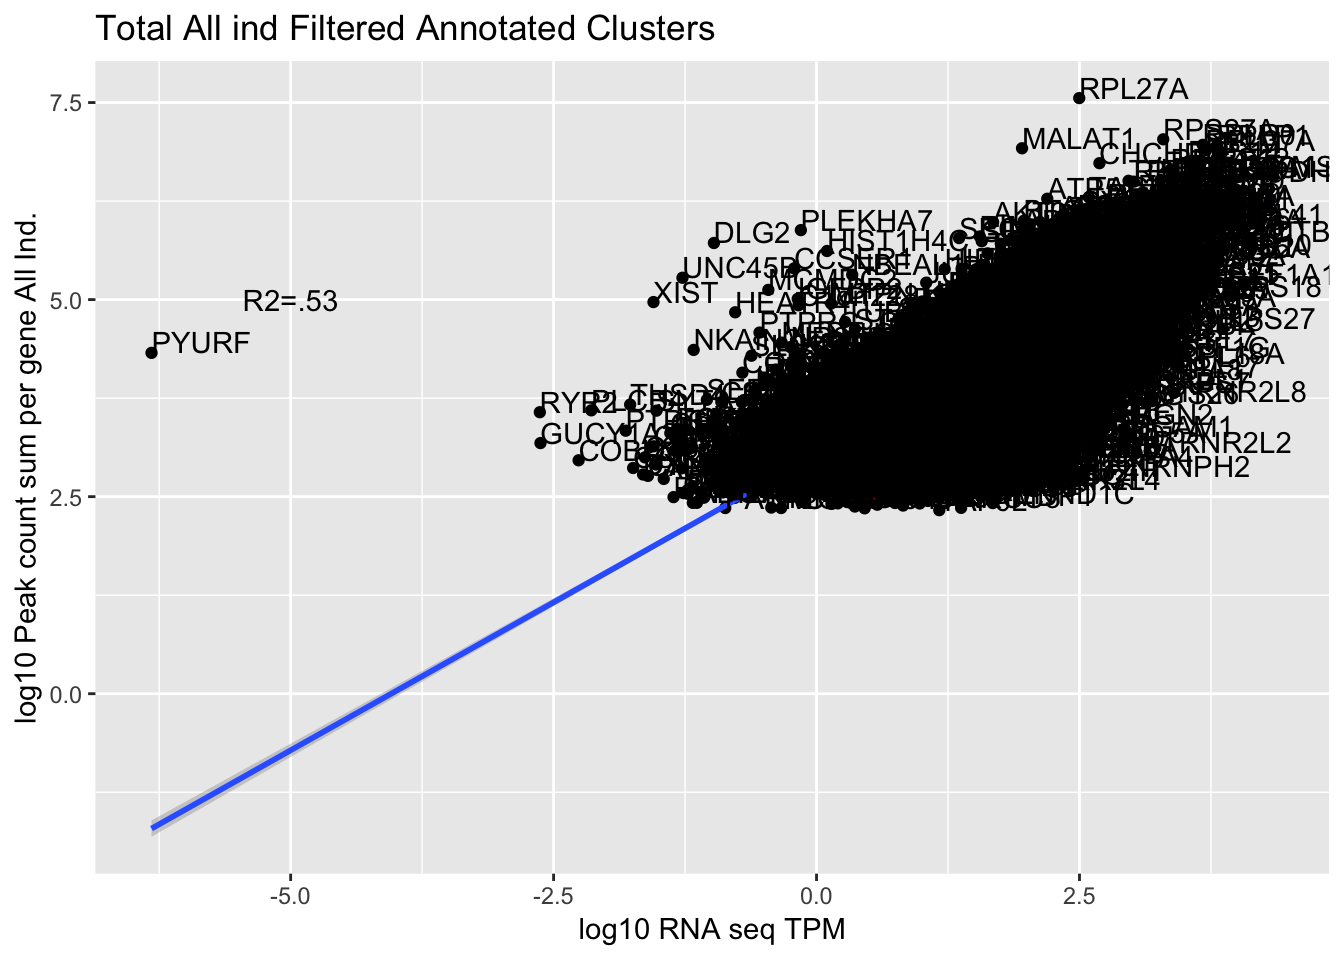
summary(lm(log10(TPM)~log10(GeneSum),TXN_abund_combLibs_tot_n0))
Call:
lm(formula = log10(TPM) ~ log10(GeneSum), data = TXN_abund_combLibs_tot_n0)

Residuals:
    Min      1Q  Median      3Q     Max
-7.8186 -0.2245  0.0180  0.2594  2.4471

Coefficients:
               Estimate Std. Error t value Pr(>|t|)
(Intercept)    -1.57143    0.02637  -59.58   <2e-16 ***
log10(GeneSum)  0.70927    0.00654  108.45   <2e-16 ***
---
Signif. codes:  0 '***' 0.001 '**' 0.01 '*' 0.05 '.' 0.1 ' ' 1

Residual standard error: 0.4606 on 10322 degrees of freedom
Multiple R-squared:  0.5326,    Adjusted R-squared:  0.5326
F-statistic: 1.176e+04 on 1 and 10322 DF, p-value: < 2.2e-16cor.test(log10(TXN_abund_combLibs_tot_n0$TPM),log10(TXN_abund_combLibs_tot_n0$GeneSum),method="spearman")Warning in cor.test.default(log10(TXN_abund_combLibs_tot_n0$TPM),
log10(TXN_abund_combLibs_tot_n0$GeneSum), : Cannot compute exact p-value
with ties
    Spearman's rank correlation rho

data:  log10(TXN_abund_combLibs_tot_n0$TPM) and log10(TXN_abund_combLibs_tot_n0$GeneSum)
S = 4.5983e+10, p-value < 2.2e-16
alternative hypothesis: true rho is not equal to 0
sample estimates:
      rho
0.7492704
The outlier is PYURF. Let me remove this gene.
TXN_abund_combLibs_tot_n0_noPYRUF= TXN_abund_combLibs_tot_n0 %>% filter(gene !="PYURF")

corr_AllLibTot_noPYRUF=ggplot(TXN_abund_combLibs_tot_n0_noPYRUF, aes(x=log10(TPM), y= log10(GeneSum))) + geom_point() + labs(title="Total All ind Filtered Annotated Clusters", x="log10 RNA seq TPM", y="log10 Peak count sum per gene All Ind.")+ geom_smooth(aes(x=log10(TPM),y=log10(GeneSum)),method = "lm") + annotate("text",x=-5, y=5,label="R2=.54") +geom_density2d(na.rm = TRUE, size = 1, colour = 'red')

#+ geom_text(aes(label=gene),hjust=0, vjust=0)

corr_AllLibTot_noPYRUF 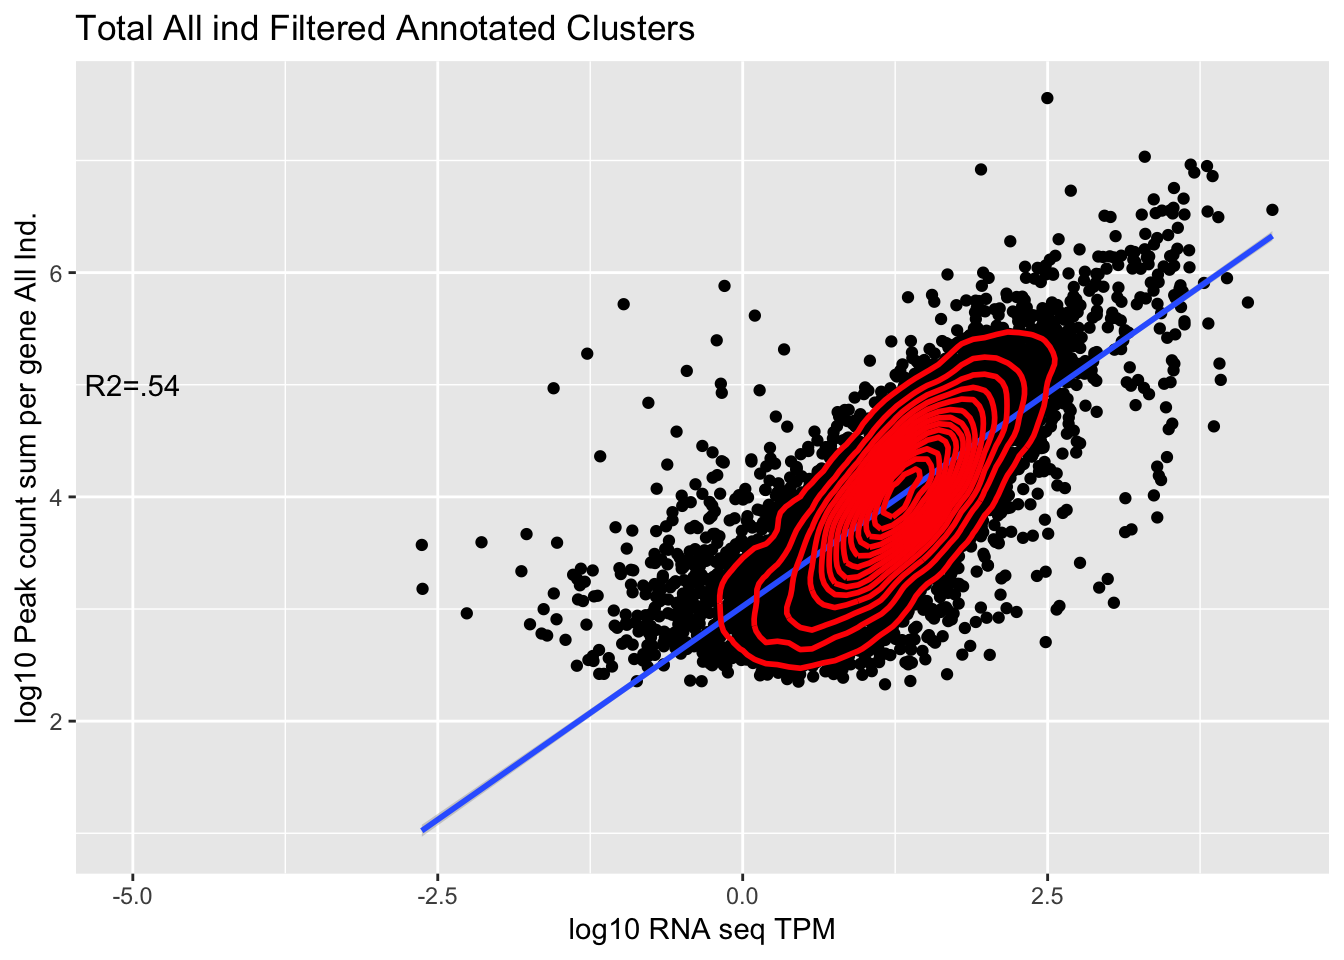
summary(lm(log10(TPM)~log10(GeneSum),TXN_abund_combLibs_tot_n0_noPYRUF))
Call:
lm(formula = log10(TPM) ~ log10(GeneSum), data = TXN_abund_combLibs_tot_n0_noPYRUF)

Residuals:
    Min      1Q  Median      3Q     Max
-3.5931 -0.2252  0.0172  0.2588  2.4468

Coefficients:
                Estimate Std. Error t value Pr(>|t|)
(Intercept)    -1.572873   0.026004  -60.48   <2e-16 ***
log10(GeneSum)  0.709829   0.006448  110.08   <2e-16 ***
---
Signif. codes:  0 '***' 0.001 '**' 0.01 '*' 0.05 '.' 0.1 ' ' 1

Residual standard error: 0.4542 on 10321 degrees of freedom
Multiple R-squared:   0.54, Adjusted R-squared:   0.54
F-statistic: 1.212e+04 on 1 and 10321 DF, p-value: < 2.2e-16cor.test(log10(TXN_abund_combLibs_tot_n0_noPYRUF$TPM),log10(TXN_abund_combLibs_tot_n0_noPYRUF$GeneSum),method="spearman")Warning in cor.test.default(log10(TXN_abund_combLibs_tot_n0_noPYRUF$TPM), :
Cannot compute exact p-value with ties
    Spearman's rank correlation rho

data:  log10(TXN_abund_combLibs_tot_n0_noPYRUF$TPM) and log10(TXN_abund_combLibs_tot_n0_noPYRUF$GeneSum)
S = 4.5925e+10, p-value < 2.2e-16
alternative hypothesis: true rho is not equal to 0
sample estimates:
      rho
0.7495161
Create mapping pheno
Now I can create the File ID file I will use to make the phenotype
create_fileid_AnnotatedCluster_total.py
fout = open("/project2/gilad/briana/threeprimeseq/data/LianoglouLCL_quant/file_id_mapping_total_AnnotatedCluster_head.txt",'w')
infile= open("/project2/gilad/briana/threeprimeseq/data/LianoglouLCL_quant/AnnotatedClusters.Total.fixed.fc", "r")
for line, i in enumerate(infile):
    if line == 0:
        i_list=i.split()
        files= i_list[10:-2]
        for each in files:
            full = each.split("/")[7]
            samp= full.split("-")[2:4]
            lim="_"
            samp_st=lim.join(samp)
            outLine= full[:-1] + "\t" + samp_st
            fout.write(outLine + "\n")
fout.close()
I need to remove the first lines of these files:
awk '{if (NR!=1) {print}}' /project2/gilad/briana/threeprimeseq/data/LianoglouLCL_quant/file_id_mapping_total_AnnotatedCluster_head.txt > /project2/gilad/briana/threeprimeseq/data/LianoglouLCL_quant/file_id_mapping_total_AnnotatedCluster.txt
I want to use the filtered peaks for the QTL analysis so I can write out the FC filtered file.
total_Cov_filt=total_Cov[keep.exprs_T,]


#write.table(total_Cov_filt, file="../data/LianoglouLCL/AnnotatedClusters.Total.fixed.filtered.fc", quote=F, col.names = T, row.names = F)
I need to manually remove the X that was added to the header. I then copy this file to the /project2/gilad/briana/threeprimeseq/data/LianoglouLCL_quant/ directory.
I dont have thier gene file. I can have the phenotpye stay the start and end of the peaks for the QTL analysis. This means I will be calling QTLs 1mb around the start of the peak.
makePheno_AnnotatedClusters_Total.py
#PYTHON 3

dic_IND = {}
dic_BAM = {}

for ln in open("/project2/gilad/briana/threeprimeseq/data/LianoglouLCL_quant/file_id_mapping_total_AnnotatedCluster.txt"):
    bam, IND = ln.split()
    IND = IND.strip()
    dic_IND[bam] = IND
    if IND not in dic_BAM:
        dic_BAM[IND] = []
    dic_BAM[IND].append(bam)


#now I have ind dic with keys as the bam and ind as the values
#I also have a bam dic with ind as the keys and bam as the values

inds=list(dic_BAM.keys()) #list of ind libraries

#list of genes

count_file=open("/project2/gilad/briana/threeprimeseq/data/LianoglouLCL_quant/AnnotatedClusters.Total.fixed.filtered.fc", "r")
genes=[]
for line , i in enumerate(count_file):
    if line > 1:
        i_list=i.split()
        id=i_list[0]
        id_list=id.split(":")
        gene=id_list[5]
        if gene not in genes:
            genes.append(gene)

#make the ind and gene dic
dic_dub={}
for g in genes:
    dic_dub[g]={}
    for i in inds:
        dic_dub[g][i]=0


#populate the dictionary
count_file=open("/project2/gilad/briana/threeprimeseq/data/LianoglouLCL_quant/AnnotatedClusters.Total.fixed.filtered.fc", "r")
for line, i in enumerate(count_file):
    if line > 1:
        i_list=i.split()
        id=i_list[0]
        id_list=id.split(":")
        g= id_list[5]
        values=list(i_list[6:])
        list_list=[]
        for ind,val in zip(inds, values):
            list_list.append([ind, val])
        for num, name in enumerate(list_list):
            dic_dub[g][list_list[num][0]] += int(list_list[num][1])


#write the file by acessing the dictionary and putting values in the table ver the value in the dic


fout=open("/project2/gilad/briana/threeprimeseq/data/LianoglouLCL_quant/AnnotatedClusters.Total.fixed.filtered_pheno_Total.txt","w")
peak=["chrom"]
inds_noL=[]
for each in inds:
    indsNA= "NA" + each[:-2]
    inds_noL.append(indsNA)
fout.write(" ".join(peak + inds_noL) + '\n' )
count_file=open("/project2/gilad/briana/threeprimeseq/data/LianoglouLCL_quant/AnnotatedClusters.Total.fixed.filtered.fc", "r")
for line , i in enumerate(count_file):
    if line > 1:
        i_list=i.split()
        id=i_list[0]
        id_list=id.split(":")
        gene=id_list[5]
        buff=[id]
        start=int(id_list[2])
        end=int(id_list[3])
        buff=[]
        buff.append("chr%s:%d:%d:%s_%s_%s"%(id_list[1], start, end, id_list[5], id_list[4], id_list[0]))
        for x,y in zip(i_list[6:], inds):
            b=int(dic_dub[gene][y])
            t=int(x)
            buff.append("%d/%d"%(t,b))
        fout.write(" ".join(buff)+ '\n')

fout.close()
Make a script to run this:
run_makePhen_AnnotatedCluster.sh
#!/bin/bash

#SBATCH --job-name=run_makePhen_AnnotatedCluster
#SBATCH --account=pi-yangili1
#SBATCH --time=24:00:00
#SBATCH --output=run_makePhen_AnnotatedCluster.out
#SBATCH --error=run_makePhen_AnnotatedCluster.err
#SBATCH --partition=broadwl
#SBATCH --mem=12G
#SBATCH --mail-type=END

module load Anaconda3
source activate three-prime-env

python makePheno_AnnotatedClusters_Total.py
Use leafcutter to prepare this for fastQTL
module load samtools
#zip file
gzip /project2/gilad/briana/threeprimeseq/data/c/AnnotatedClusters.Total.fixed.filtered_pheno_Total.txt

module load python
#leafcutter script
python /project2/gilad/briana/threeprimeseq/code/prepare_phenotype_table.py /project2/gilad/briana/threeprimeseq/data/LianoglouLCL_quant/AnnotatedClusters.Total.fixed.filtered_pheno_Total.txt.gz

#source activate three-prime-env
sh /project2/gilad/briana/threeprimeseq/data/LianoglouLCL_quant/AnnotatedClusters.Total.fixed.filtered_pheno_Total.txt.gz_prepare.sh


#keep only 2 PCs
head -n 3 AnnotatedClusters.Total.fixed.filtered_pheno_Total.txt.gz.PCs > /project2/gilad/briana/threeprimeseq/data/LianoglouLCL_quant/AnnotatedClusters.Total.fixed.filtered_pheno_Total.txt.gz.2PCs
Sample list for Fastqtl is /project2/gilad/briana/threeprimeseq/data/phenotypes_filtPeakTranscript/SAMPLE.txt
Run FastQTL
APAqtl_nominal_annotatedClusters.sh
#!/bin/bash


#SBATCH --job-name=APAqtl_nominal_transcript
#SBATCH --account=pi-yangili1
#SBATCH --time=24:00:00
#SBATCH --output=APAqtl_nominal_transcript.out
#SBATCH --error=APAqtl_nominal_transcript.err
#SBATCH --partition=broadwl
#SBATCH --mem=12G
#SBATCH --mail-type=END


for i in 1 2 3 4 5 6 7 8 9 10 11 12 13 14 15 16 17 18 19 20 21 22
do
/home/brimittleman/software/bin/FastQTL/bin/fastQTL.static --vcf /project2/gilad/briana/YRI_geno_hg19/chr$i.dose.filt.vcf.gz --cov /project2/gilad/briana/threeprimeseq/data/LianoglouLCL_quant/AnnotatedClusters.Total.fixed.filtered_pheno_Total.txt.gz.2PCs --bed /project2/gilad/briana/threeprimeseq/data/LianoglouLCL_quant/AnnotatedClusters.Total.fixed.filtered_pheno_Total.txt.gz.qqnorm_chr$i.gz --out /project2/gilad/briana/threeprimeseq/data/nominal_APAqtl_Annotated/AnnotatedClusters.Total.fixed.filtered_pheno_Total.txt.gz.qqnorm_chr$i.nominal.out --chunk 1 1  --window 5e5 --include-samples /project2/gilad/briana/threeprimeseq/data/phenotypes_filtPeakTranscript/SAMPLE.txt
done
APAqtl_permuted_annotatedClusters.sh
#!/bin/bash


#SBATCH --job-name=APAqtl_permuted_annotatedClusters
#SBATCH --account=pi-yangili1
#SBATCH --time=24:00:00
#SBATCH --output=APAqtl_permuted_annotatedClusters.out
#SBATCH --error=APAqtl_permuted_annotatedClusters.err
#SBATCH --partition=broadwl
#SBATCH --mem=12G
#SBATCH --mail-type=END

for i in 1 2 3 4 5 6 7 8 9 10 11 12 13 14 15 16 17 18 19 20 21 22
do
/home/brimittleman/software/bin/FastQTL/bin/fastQTL.static --permute 1000 --vcf /project2/gilad/briana/YRI_geno_hg19/chr$i.dose.filt.vcf.gz --cov /project2/gilad/briana/threeprimeseq/data/LianoglouLCL_quant/AnnotatedClusters.Total.fixed.filtered_pheno_Total.txt.gz.2PCs --bed /project2/gilad/briana/threeprimeseq/data/LianoglouLCL_quant/AnnotatedClusters.Total.fixed.filtered_pheno_Total.txt.gz.qqnorm_chr$i.gz --out /project2/gilad/briana/threeprimeseq/data/perm_APAqtl_Annotated/AnnotatedClusters.Total.fixed.filtered_pheno_Total.txt.gz.qqnorm_chr$i.perm.out --chunk 1 1  --window 5e5 --include-samples /project2/gilad/briana/threeprimeseq/data/phenotypes_filtPeakTranscript/SAMPLE.txt
done
APAqtlpermCorrectQQplot_Annotated.R
library(dplyr)


##total results
tot.perm= read.table("/project2/gilad/briana/threeprimeseq/data/perm_APAqtl_Annotated/AnnotatedClusters.Total.fixed.filtered_pheno_Total_permRes.txt",head=F, stringsAsFactors=F, col.names = c("pid", "nvar", "shape1", "shape2", "dummy", "sid", "dist", "npval", "slope", "ppval", "bpval"))

#BH correction
tot.perm$bh=p.adjust(tot.perm$bpval, method="fdr")

#plot qqplot
png("/project2/gilad/briana/threeprimeseq/output/plots/qqplot_total_APAperm_AnnotatedClusters.png")
qqplot_total= qqplot(-log10(runif(nrow(tot.perm))), -log10(tot.perm$bpval),ylab="-log10 Total permuted pvalue", xlab="Uniform expectation", main="Total permuted pvalues for all snps with Annotated Clusters")
abline(0,1)
dev.off()

#write df with BH

write.table(tot.perm, file = "/project2/gilad/briana/threeprimeseq/data/perm_APAqtl_Annotated/AnnotatedClusters.Total.fixed.filtered_pheno_Total_permRes.BH.txt", col.names = T, row.names = F, quote = F)
run_APAqtlpermCorrectQQplot_Annotated.sh
#!/bin/bash


#SBATCH --job-name=run_APAqtlpermCorrectQQplot_Annotated
#SBATCH --account=pi-yangili1
#SBATCH --time=24:00:00
#SBATCH --output=run_APAqtlpermCorrectQQplot_Annotated.out
#SBATCH --error=run_APAqtlpermCorrectQQplot_Annotated.err
#SBATCH --partition=broadwl
#SBATCH --mem=12G
#SBATCH --mail-type=END

module load Anaconda3
source activate three-prime-env


Rscript APAqtlpermCorrectQQplot_Annotated.R
tot.perm= read.table("../data/LianoglouLCL/AnnotatedClusters.Total.fixed.filtered_pheno_Total_permRes.BH.txt",head=T, stringsAsFactors=F)
plot(tot.perm$ppval, tot.perm$bpval, xlab="Direct method", ylab="Beta approximation", main="Total Check plot")
abline(0, 1, col="red")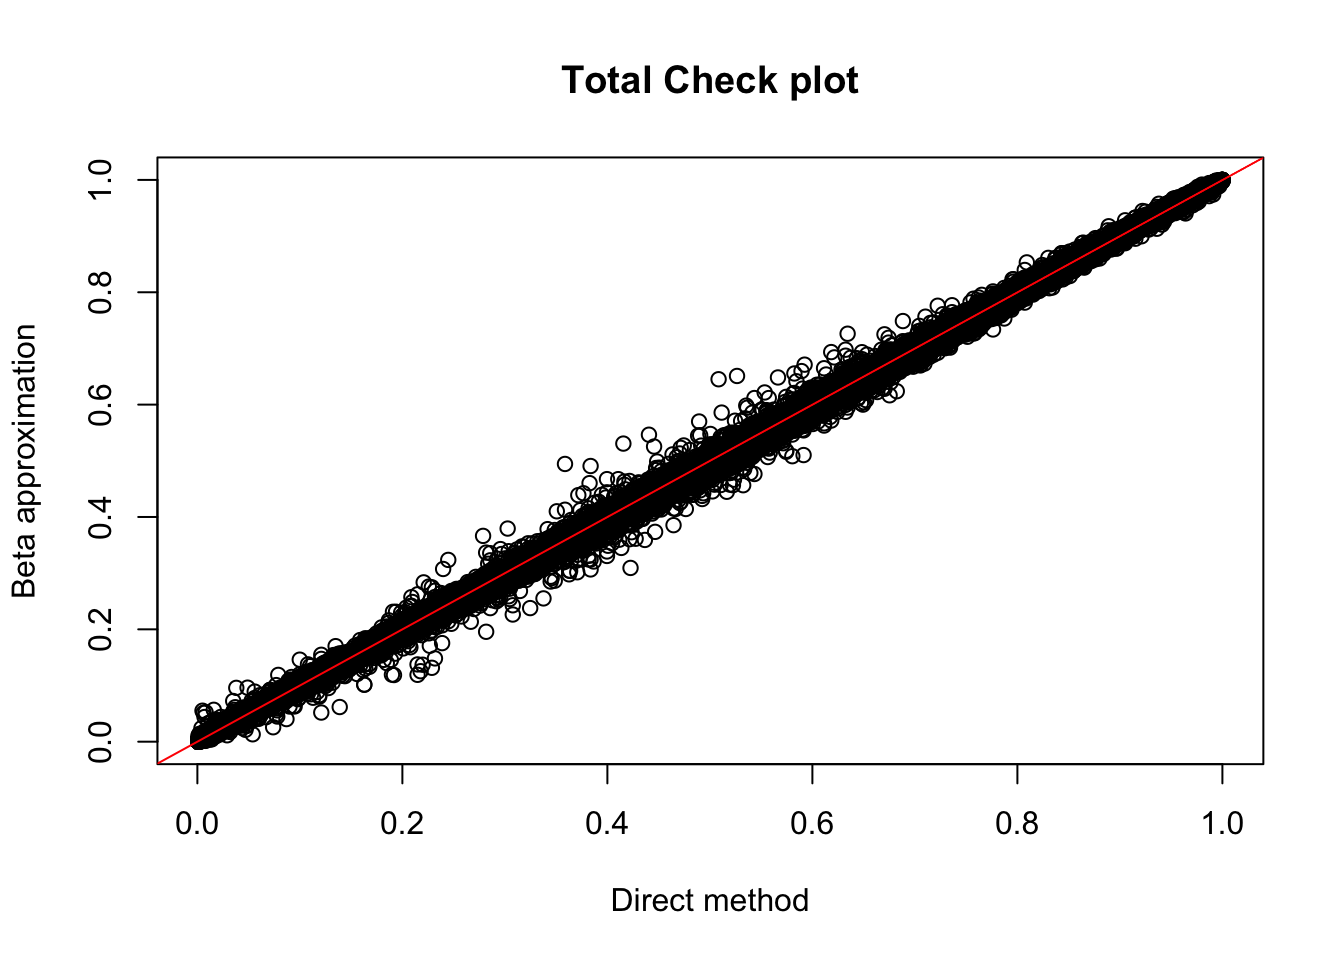
tot_qtl_10= tot.perm %>% filter(-log10(bh) > 1) %>% nrow()
tot_qtl_10
[1] 149Use deeptools to look at enrichment at these peaks
https://brimittleman.github.io/Net-seq/use_deeptools.html
I can reuse code from the analysis above.
I want to merge the total and nuclear bam files then convert them to bw.
mergebamfiles.sh
#!/bin/bash

#SBATCH --job-name=mergebamfiles
#SBATCH --account=pi-yangili1
#SBATCH --time=24:00:00
#SBATCH --output=mergebamfiles.out
#SBATCH --error=mergebamfiles.err
#SBATCH --partition=broadwl
#SBATCH --mem=36G
#SBATCH --mail-type=END

module load Anaconda3
source activate three-prime-env

#total

samtools merge /project2/gilad/briana/threeprimeseq/data/mergedBams/Total_MergedBams.bam  /project2/gilad/briana/threeprimeseq/data/sort/*T-combined-sort.bam

#nuclear
samtools merge /project2/gilad/briana/threeprimeseq/data/mergedBams/Nuclear_MergedBams.bam  /project2/gilad/briana/threeprimeseq/data/sort/*N-combined-sort.bam
sort and index the bams
SortIndexMergedBams.sh
#!/bin/bash

#SBATCH --job-name=SortIndexMergedBams
#SBATCH --account=pi-yangili1
#SBATCH --time=24:00:00
#SBATCH --output=SortIndexMergedBams.out
#SBATCH --error=SortIndexMergedBams.err
#SBATCH --partition=broadwl
#SBATCH --mem=36G
#SBATCH --mail-type=END

module load Anaconda3
source activate three-prime-env


samtools sort /project2/gilad/briana/threeprimeseq/data/mergedBams/Total_MergedBams.bam > /project2/gilad/briana/threeprimeseq/data/mergedBams/Total_MergedBams.sort.bam

samtools index /project2/gilad/briana/threeprimeseq/data/mergedBams/Total_MergedBams.sort.bam

samtools sort /project2/gilad/briana/threeprimeseq/data/mergedBams/Nuclear_MergedBams.bam > /project2/gilad/briana/threeprimeseq/data/mergedBams/Nuclear_MergedBams.sort.bam

samtools index /project2/gilad/briana/threeprimeseq/data/mergedBams/Nuclear_MergedBams.sort.bam
Create bw from each
mergeBam2BW.sh
#!/bin/bash

#SBATCH --job-name=mergeBam2BW
#SBATCH --account=pi-yangili1
#SBATCH --time=24:00:00
#SBATCH --output=mergeBam2BW.out
#SBATCH --error=mergeBam2BW.err
#SBATCH --partition=bigmem2
#SBATCH --mem=100G
#SBATCH --mail-type=END

module load Anaconda3
source activate three-prime-env

#total
bamCoverage -b /project2/gilad/briana/threeprimeseq/data/mergedBams/Total_MergedBams.sort.bam -o /project2/gilad/briana/threeprimeseq/data/mergedBW/Total_MergedBamCoverage.bw

#nuclear
bamCoverage -b /project2/gilad/briana/threeprimeseq/data/mergedBams/Nuclear_MergedBams.sort.bam -o /project2/gilad/briana/threeprimeseq/data/mergedBW/Nuclear_MergedBamCoverage.bw
Make a deep tools plot by computing the matrix then making the plot:
totalDTPlotLianoglouData.sh
#!/bin/bash

#SBATCH --job-name=totalDTPlotLianoglouData.sh
#SBATCH --account=pi-yangili1
#SBATCH --time=24:00:00
#SBATCH --output=totalDTPlotLianoglouData.sh.out
#SBATCH --error=totalDTPlotLianoglouData.sh.err
#SBATCH --partition=bigmem2
#SBATCH --mem=100G
#SBATCH --mail-type=END

module load Anaconda3
source activate three-prime-env

computeMatrix reference-point -S /project2/gilad/briana/threeprimeseq/data/mergedBW/Total_MergedBamCoverage.bw -R /project2/gilad/briana/threeprimeseq/data/LianoglouLCL/SRR1005684.3pSites.highconfidence.ip.OK_noCHR_sort_tabsep.bed -b 1000 -a 1000 -out /project2/gilad/briana/threeprimeseq/data/LianoglouDeepTools/Total_LianoglouOKPeaks.gz

plotHeatmap --sortRegions descend -m /project2/gilad/briana/threeprimeseq/data/LianoglouDeepTools/Total_LianoglouOKPeaks.gz -out /project2/gilad/briana/threeprimeseq/data/LianoglouDeepTools/Total_LianoglouOKPeaks.png
not recongiizing /project2/gilad/briana/threeprimeseq/data/LianoglouLCL/SRR1005684.3pSites.highconfidence.ip.OK_noCHR.bed
awk '{ print ($1"\t"$2"\t"$3"\t"$4"\t"$5"\t"$6"\t") }' /project2/gilad/briana/threeprimeseq/data/LianoglouLCL/SRR1005684.3pSites.highconfidence.ip.OK_noCHR_sort.bed > /project2/gilad/briana/threeprimeseq/data/LianoglouLCL/SRR1005684.3pSites.highconfidence.ip.OK_noCHR_sort_tabsep.bed
Do this with the nuclear as well.
nucelarDTPlotLianoglouData.sh
#!/bin/bash

#SBATCH --job-name=nuclearDTPlotLianoglouData.sh
#SBATCH --account=pi-yangili1
#SBATCH --time=24:00:00
#SBATCH --output=nuclearDTPlotLianoglouData.sh.out
#SBATCH --error=nuclearDTPlotLianoglouData.sh.err
#SBATCH --partition=bigmem2
#SBATCH --mem=100G
#SBATCH --mail-type=END

module load Anaconda3
source activate three-prime-env

computeMatrix reference-point -S /project2/gilad/briana/threeprimeseq/data/mergedBW/Nuclear_MergedBamCoverage.bw -R /project2/gilad/briana/threeprimeseq/data/LianoglouLCL/SRR1005684.3pSites.highconfidence.ip.OK_noCHR_sort_tabsep.bed -b 1000 -a 1000 --outFileName /project2/gilad/briana/threeprimeseq/data/LianoglouDeepTools/Nuclear_LianoglouOKPeaks.gz

plotHeatmap --sortRegions descend -m /project2/gilad/briana/threeprimeseq/data/LianoglouDeepTools/Nuclear_LianoglouOKPeaks.gz --outFileName /project2/gilad/briana/threeprimeseq/data/LianoglouDeepTools/Nuclear_LianoglouOKPeaks.png
I can do this in the same plot by making the matrix with both:
BothFracDTPlotLianoglouData.sh
#!/bin/bash

#SBATCH --job-name=BothFracDTPlotLianoglouData.sh
#SBATCH --account=pi-yangili1
#SBATCH --time=24:00:00
#SBATCH --output=BothFracDTPlotLianoglouData.out
#SBATCH --error=BothFracDTPlotLianoglouData.err
#SBATCH --partition=bigmem2
#SBATCH --mem=100G
#SBATCH --mail-type=END

module load Anaconda3
source activate three-prime-env


computeMatrix reference-point -S /project2/gilad/briana/threeprimeseq/data/mergedBW/Total_MergedBamCoverage.bw /project2/gilad/briana/threeprimeseq/data/mergedBW/Nuclear_MergedBamCoverage.bw -R /project2/gilad/briana/threeprimeseq/data/LianoglouLCL/SRR1005684.3pSites.highconfidence.ip.OK_noCHR_sort_tabsep.bed -b 1000 -a 1000  -~out /project2/gilad/briana/threeprimeseq/data/LianoglouDeepTools/BothFrac_LianoglouOKPeaks.gz

plotHeatmap --sortRegions descend -m /project2/gilad/briana/threeprimeseq/data/LianoglouDeepTools/BothFrac_LianoglouOKPeaks.gz --refPointLabel "Annotated PAS" --plotTitle "Combined Reads at annotated PAS"  --heatmapHeight 7 --colorMap YlGnBu  -out /project2/gilad/briana/threeprimeseq/data/LianoglouDeepTools/BothFrac_LianoglouOKPeaks.png
–regionsLabel
As a control, I will make a plot using the TSS of genes. I will do this at a transcript level with the file ncbiRefSeq.mRNA.named_noCHR.bed. If the transcript is on the positive strand the TSS is the start and the start +1. If the transcript is on the negative strand the TSS is the end-1 and the end. I can make a bed file in python.
refseqTSS.py
inFile=open("/project2/gilad/briana/genome_anotation_data/ncbiRefSeq.mRNA.named_noCHR.bed","r")
outFile=open("/project2/gilad/briana/genome_anotation_data/ncbiRefSeq.mRNA.transcriptTSS.bed", "w")

for ln in inFile:
  chrom, start, end, transcript, gene, strand = ln.split()
  if strand =="+":
    start_i=int(start)
    end_i=int(start)+1
    outFile.write("%s\t%d\t%d\t%s\t%s\t%s\n"%(chrom,start_i,end_i, transcript, gene, strand))
  else:
    start_i=int(end)-1
    end_i=int(end)
    outFile.write("%s\t%d\t%d\t%s\t%s\t%s\n"%(chrom,start_i,end_i, transcript, gene, strand))
outFile.close
Use this in deeptools command.
totalDTPlotTSS.sh
#!/bin/bash

#SBATCH --job-name=totalDTPlotTSS.sh
#SBATCH --account=pi-yangili1
#SBATCH --time=24:00:00
#SBATCH --output=totalDTPlotTSS.out
#SBATCH --error=totalDTPlotTSS.err
#SBATCH --partition=bigmem2
#SBATCH --mem=100G
#SBATCH --mail-type=END

module load Anaconda3
source activate three-prime-env

computeMatrix reference-point -S /project2/gilad/briana/threeprimeseq/data/mergedBW/Total_MergedBamCoverage.bw -R /project2/gilad/briana/genome_anotation_data/ncbiRefSeq.mRNA.transcriptTSS.bed -b 1000 -a 1000 -out /project2/gilad/briana/threeprimeseq/data/LianoglouDeepTools/Total_RefSeqTSS.gz

plotHeatmap --sortRegions descend -m /project2/gilad/briana/threeprimeseq/data/LianoglouDeepTools/Total_RefSeqTSS.gz -out /project2/gilad/briana/threeprimeseq/data/LianoglouDeepTools/Total_RefSeqTSS.png
Do this with the nuclear as well.
nuclearDTPlotTSS.sh
#!/bin/bash

#SBATCH --job-name=nuclearDTPlotTSS.sh
#SBATCH --account=pi-yangili1
#SBATCH --time=24:00:00
#SBATCH --output=nuclearDTPlotTSS.out
#SBATCH --error=nuclearDTPlotTSS.err
#SBATCH --partition=bigmem2
#SBATCH --mem=100G
#SBATCH --mail-type=END

module load Anaconda3
source activate three-prime-env

computeMatrix reference-point -S /project2/gilad/briana/threeprimeseq/data/mergedBW/Nuclear_MergedBamCoverage.bw -R /project2/gilad/briana/genome_anotation_data/ncbiRefSeq.mRNA.transcriptTSS.bed -b 1000 -a 1000 -out /project2/gilad/briana/threeprimeseq/data/LianoglouDeepTools/Nuclear_RefSeqTSS.gz

plotHeatmap --sortRegions descend -m /project2/gilad/briana/threeprimeseq/data/LianoglouDeepTools/Nuclear_RefSeqTSS.gz -out /project2/gilad/briana/threeprimeseq/data/LianoglouDeepTools/Nuclear_RefSeqTSS.png
Make both of these on the same plot like I did for the annotated clusters.
BothFracDTPlotTSS.sh
#!/bin/bash

#SBATCH --job-name=BothFracDTPlotTSS.sh
#SBATCH --account=pi-yangili1
#SBATCH --time=24:00:00
#SBATCH --output=BothFracDTPlotTSS.out
#SBATCH --error=BothFracDTPlotTSS.err
#SBATCH --partition=bigmem2
#SBATCH --mem=100G
#SBATCH --mail-type=END

module load Anaconda3
source activate three-prime-env


computeMatrix reference-point -S /project2/gilad/briana/threeprimeseq/data/mergedBW/Total_MergedBamCoverage.bw /project2/gilad/briana/threeprimeseq/data/mergedBW/Nuclear_MergedBamCoverage.bw -R /project2/gilad/briana/genome_anotation_data/ncbiRefSeq.mRNA.transcriptTSS.bed -b 1000 -a 1000  -out /project2/gilad/briana/threeprimeseq/data/LianoglouDeepTools/BothFrac_RefSeqTSS.gz

plotHeatmap --sortRegions descend -m /project2/gilad/briana/threeprimeseq/data/LianoglouDeepTools/BothFrac_RefSeqTSS.gz --refPointLabel "TSS" --plotTitle "Combined Reads at TSS" --regionsLabel "RefSeq Transcript" --heatmapHeight 7 --colorMap YlGnBu  -out /project2/gilad/briana/threeprimeseq/data/LianoglouDeepTools/BothFrac_RefseqTSS.png
I should also do this with our peaks. Then we will have all of them to compare:
BothFracDTPlotmyPeaks.sh
#!/bin/bash

#SBATCH --job-name=BothFracDTPlotmyPeaks.sh
#SBATCH --account=pi-yangili1
#SBATCH --time=24:00:00
#SBATCH --output=BothFracDTPlotmyPeaks.out
#SBATCH --error=BothFracDTPlotmyPeaks.err
#SBATCH --partition=bigmem2
#SBATCH --mem=100G
#SBATCH --mail-type=END

module load Anaconda3
source activate three-prime-env


computeMatrix reference-point -S /project2/gilad/briana/threeprimeseq/data/mergedBW/Total_MergedBamCoverage.bw /project2/gilad/briana/threeprimeseq/data/mergedBW/Nuclear_MergedBamCoverage.bw -R /project2/gilad/briana/threeprimeseq/data/mergedPeaks_comb/filtered_APApeaks_merged_allchrom_refseqTrans.noties_sm.fixed.bed -b 1000 -a 1000  --out /project2/gilad/briana/threeprimeseq/data/LianoglouDeepTools/BothFrac_myPeaks.gz

plotHeatmap --sortRegions descend -m /project2/gilad/briana/threeprimeseq/data/LianoglouDeepTools/BothFrac_myPeaks.gz --refPointLabel "Called Peaks" --plotTitle "Combined Reads at All Called Peaks" --heatmapHeight 7 --colorMap YlGnBu  -out /project2/gilad/briana/threeprimeseq/data/LianoglouDeepTools/BothFrac_myPeaks.png
Use Deeptools to make the same plots but with RNA seq
First I need to merge the bam files.
mergeRNAseqbamfiles.sh
#!/bin/bash

#SBATCH --job-name=mergeRNAseqbamfiles
#SBATCH --account=pi-yangili1
#SBATCH --time=24:00:00
#SBATCH --output=mergeRNAseqbamfiles.out
#SBATCH --error=mergeRNAseqbamfiles.err
#SBATCH --partition=broadwl
#SBATCH --mem=36G
#SBATCH --mail-type=END

module load Anaconda3
source activate three-prime-env


samtools merge /project2/gilad/briana/threeprimeseq/data/rnaseq_bam/RNAseqGeuvadis_STAR_6samp_MergedBams.bam /project2/yangili1/LCL/RNAseqGeuvadisBams/RNAseqGeuvadis_STAR_184*.final.bam
Sort and index the bam file:
SortIndexRNAseqMergedBams.sh
#!/bin/bash

#SBATCH --job-name=SortIndexRNAseqMergedBams
#SBATCH --account=pi-yangili1
#SBATCH --time=24:00:00
#SBATCH --output=SortIndexRNAseqMergedBams.out
#SBATCH --error=SortIndexRNAseqMergedBams.err
#SBATCH --partition=broadwl
#SBATCH --mem=36G
#SBATCH --mail-type=END

module load Anaconda3
source activate three-prime-env


samtools sort /project2/gilad/briana/threeprimeseq/data/rnaseq_bam/RNAseqGeuvadis_STAR_6samp_MergedBams.bam > /project2/gilad/briana/threeprimeseq/data/rnaseq_bam/RNAseqGeuvadis_STAR_6samp_MergedBams.sort.bam

samtools index /project2/gilad/briana/threeprimeseq/data/rnaseq_bam/RNAseqGeuvadis_STAR_6samp_MergedBams.sort.bam
Make BW file from the bam
mergeRNAseqBam2BW.sh
#!/bin/bash

#SBATCH --job-name=mergeRNAseqBam2BW
#SBATCH --account=pi-yangili1
#SBATCH --time=24:00:00
#SBATCH --output=mergeRNAseqBam2BW.out
#SBATCH --error=mergeRNAseqBam2BW.err
#SBATCH --partition=bigmem2
#SBATCH --mem=100G
#SBATCH --mail-type=END

module load Anaconda3
source activate three-prime-env


bamCoverage -b /project2/gilad/briana/threeprimeseq/data/rnaseq_bam/RNAseqGeuvadis_STAR_6samp_MergedBams.sort.bam -o /project2/gilad/briana/threeprimeseq/data/rnaseq_bw//RNAseqGeuvadis_STAR_6samp_MergedBams.sort.bw
Run the 3 deeptools plots
RNAseqDTPlotLianoglouData.sh
#!/bin/bash

#SBATCH --job-name=RNAseqDTPlotLianoglouData.sh.sh
#SBATCH --account=pi-yangili1
#SBATCH --time=24:00:00
#SBATCH --output=RNAseqDTPlotLianoglouData.out
#SBATCH --error=RNAseqDTPlotLianoglouData.err
#SBATCH --partition=bigmem2
#SBATCH --mem=100G
#SBATCH --mail-type=END

module load Anaconda3
source activate three-prime-env


computeMatrix reference-point -S /project2/gilad/briana/threeprimeseq/data/rnaseq_bw//RNAseqGeuvadis_STAR_6samp_MergedBams.sort.bw   -R /project2/gilad/briana/threeprimeseq/data/LianoglouLCL/SRR1005684.3pSites.highconfidence.ip.OK_noCHR_sort_tabsep.bed -b 1000 -a 1000  -out /project2/gilad/briana/threeprimeseq/data/rnaseq_deeptools/RNAseq_LianoglouOKPeaks.gz

plotHeatmap --sortRegions descend -m /project2/gilad/briana/threeprimeseq/data/rnaseq_deeptools/RNAseq_LianoglouOKPeaks.gz --refPointLabel "Annotated PAS" --plotTitle "Combined RNAseq Reads at annotated PAS"  --heatmapHeight 7 --colorMap YlGnBu  -out /project2/gilad/briana/threeprimeseq/data/rnaseq_deeptools/RNAseq_LianoglouOKPeaks.png
RNAseqDTPlotTSS.sh
#!/bin/bash

#SBATCH --job-name=RNAseqDTPlotTSS.sh
#SBATCH --account=pi-yangili1
#SBATCH --time=24:00:00
#SBATCH --output=RNAseqDTPlotTSS.out
#SBATCH --error=RNAseqDTPlotTSS.err
#SBATCH --partition=bigmem2
#SBATCH --mem=100G
#SBATCH --mail-type=END

module load Anaconda3
source activate three-prime-env


computeMatrix reference-point -S /project2/gilad/briana/threeprimeseq/data/rnaseq_bw//RNAseqGeuvadis_STAR_6samp_MergedBams.sort.bw -R /project2/gilad/briana/genome_anotation_data/ncbiRefSeq.mRNA.transcriptTSS.bed -b 1000 -a 1000  -out /project2/gilad/briana/threeprimeseq/data/rnaseq_deeptools/RNAseq_RefSeqTSS.gz

plotHeatmap --sortRegions descend -m /project2/gilad/briana/threeprimeseq/data/rnaseq_deeptools/RNAseq_RefSeqTSS.gz --refPointLabel "TSS" --plotTitle "Combined RNAseq Reads at TSS" --regionsLabel "RefSeq Transcript" --heatmapHeight 7 --colorMap YlGnBu  -out /project2/gilad/briana/threeprimeseq/data/rnaseq_deeptools/RNAseq_RefSeqTSS.png
RNAseqDTPlotmyPeaks.sh
#!/bin/bash

#SBATCH --job-name=RNAseqDTPlotmyPeaks.sh
#SBATCH --account=pi-yangili1
#SBATCH --time=24:00:00
#SBATCH --output=RNAseqDTPlotmyPeaks.out
#SBATCH --error=RNAseqDTPlotmyPeaks.err
#SBATCH --partition=bigmem2
#SBATCH --mem=100G
#SBATCH --mail-type=END

module load Anaconda3
source activate three-prime-env


computeMatrix reference-point -S /project2/gilad/briana/threeprimeseq/data/rnaseq_bw//RNAseqGeuvadis_STAR_6samp_MergedBams.sort.bw -R /project2/gilad/briana/threeprimeseq/data/mergedPeaks_comb/filtered_APApeaks_merged_allchrom_refseqTrans.noties_sm.fixed.bed -b 1000 -a 1000  -out /project2/gilad/briana/threeprimeseq/data/rnaseq_deeptools/RNAseq_myPeaks.gz

plotHeatmap --sortRegions descend -m /project2/gilad/briana/threeprimeseq/data/rnaseq_deeptools/RNAseq_myPeaks.gz --refPointLabel "Called Peaks" --plotTitle "Combined RNAseq Reads at All Called Peaks" --heatmapHeight 7 --colorMap YlGnBu  -out /project2/gilad/briana/threeprimeseq/data/rnaseq_deeptools/RNAseq_myPeaks.png
Session information
sessionInfo()R version 3.5.1 (2018-07-02)
Platform: x86_64-apple-darwin15.6.0 (64-bit)
Running under: macOS 10.14.1
Matrix products: default
BLAS: /Library/Frameworks/R.framework/Versions/3.5/Resources/lib/libRblas.0.dylib
LAPACK: /Library/Frameworks/R.framework/Versions/3.5/Resources/lib/libRlapack.dylib
locale:
[1] en_US.UTF-8/en_US.UTF-8/en_US.UTF-8/C/en_US.UTF-8/en_US.UTF-8
attached base packages:
[1] stats graphics grDevices utils datasets methods base
other attached packages:
[1] ggpubr_0.1.8 magrittr_1.5 bindrcpp_0.2.2 tximport_1.8.0
[5] edgeR_3.22.5 limma_3.36.5 forcats_0.3.0 stringr_1.3.1
[9] dplyr_0.7.6 purrr_0.2.5 readr_1.1.1 tidyr_0.8.1
[13] tibble_1.4.2 ggplot2_3.0.0 tidyverse_1.2.1 workflowr_1.1.1
loaded via a namespace (and not attached):
[1] locfit_1.5-9.1 tidyselect_0.2.4 haven_1.1.2
[4] lattice_0.20-35 colorspace_1.3-2 htmltools_0.3.6
[7] yaml_2.2.0 utf8_1.1.4 rlang_0.2.2
[10] R.oo_1.22.0 pillar_1.3.0 glue_1.3.0
[13] withr_2.1.2 R.utils_2.7.0 modelr_0.1.2
[16] readxl_1.1.0 bindr_0.1.1 plyr_1.8.4
[19] munsell_0.5.0 gtable_0.2.0 cellranger_1.1.0
[22] rvest_0.3.2 R.methodsS3_1.7.1 evaluate_0.11
[25] labeling_0.3 knitr_1.20 fansi_0.4.0
[28] broom_0.5.0 Rcpp_0.12.19 scales_1.0.0
[31] backports_1.1.2 jsonlite_1.5 hms_0.4.2
[34] digest_0.6.17 stringi_1.2.4 grid_3.5.1
[37] rprojroot_1.3-2 cli_1.0.1 tools_3.5.1
[40] lazyeval_0.2.1 crayon_1.3.4 whisker_0.3-2
[43] pkgconfig_2.0.2 MASS_7.3-50 xml2_1.2.0
[46] lubridate_1.7.4 assertthat_0.2.0 rmarkdown_1.10
[49] httr_1.3.1 rstudioapi_0.8 R6_2.3.0
[52] nlme_3.1-137 git2r_0.23.0 compiler_3.5.1
This reproducible R Markdown analysis was created with workflowr 1.1.1