Explore 1 Peak genes
Briana Mittleman
3/4/2019
Last updated: 2019-03-05
Checks: 6 0
Knit directory: threeprimeseq/analysis/
This reproducible R Markdown analysis was created with workflowr (version 1.2.0). The Report tab describes the reproducibility checks that were applied when the results were created. The Past versions tab lists the development history.
Great! Since the R Markdown file has been committed to the Git repository, you know the exact version of the code that produced these results.
Great job! The global environment was empty. Objects defined in the global environment can affect the analysis in your R Markdown file in unknown ways. For reproduciblity it’s best to always run the code in an empty environment.
The command set.seed(12345) was run prior to running the code in the R Markdown file. Setting a seed ensures that any results that rely on randomness, e.g. subsampling or permutations, are reproducible.
Great job! Recording the operating system, R version, and package versions is critical for reproducibility.
Nice! There were no cached chunks for this analysis, so you can be confident that you successfully produced the results during this run.
Great! You are using Git for version control. Tracking code development and connecting the code version to the results is critical for reproducibility. The version displayed above was the version of the Git repository at the time these results were generated.
Note that you need to be careful to ensure that all relevant files for the analysis have been committed to Git prior to generating the results (you can use wflow_publish or wflow_git_commit). workflowr only checks the R Markdown file, but you know if there are other scripts or data files that it depends on. Below is the status of the Git repository when the results were generated:
Ignored files:
    Ignored:    .DS_Store
    Ignored:    .Rhistory
    Ignored:    .Rproj.user/
    Ignored:    data/.DS_Store
    Ignored:    data/perm_QTL_trans_noMP_5percov/
    Ignored:    output/.DS_Store

Untracked files:
    Untracked:  KalistoAbundance18486.txt
    Untracked:  analysis/4suDataIGV.Rmd
    Untracked:  analysis/DirectionapaQTL.Rmd
    Untracked:  analysis/EmpDistforOverlaps.Rmd
    Untracked:  analysis/EvaleQTLs.Rmd
    Untracked:  analysis/YL_QTL_test.Rmd
    Untracked:  analysis/groSeqAnalysis.Rmd
    Untracked:  analysis/ncbiRefSeq_sm.sort.mRNA.bed
    Untracked:  analysis/snake.config.notes.Rmd
    Untracked:  analysis/verifyBAM.Rmd
    Untracked:  analysis/verifybam_dubs.Rmd
    Untracked:  code/PeaksToCoverPerReads.py
    Untracked:  code/strober_pc_pve_heatmap_func.R
    Untracked:  data/18486.genecov.txt
    Untracked:  data/APApeaksYL.total.inbrain.bed
    Untracked:  data/AllPeak_counts/
    Untracked:  data/ApaQTLs/
    Untracked:  data/ApaQTLs_otherPhen/
    Untracked:  data/ChromHmmOverlap/
    Untracked:  data/DistTXN2Peak_genelocAnno/
    Untracked:  data/FeatureoverlapPeaks/
    Untracked:  data/GM12878.chromHMM.bed
    Untracked:  data/GM12878.chromHMM.txt
    Untracked:  data/LianoglouLCL/
    Untracked:  data/LocusZoom/
    Untracked:  data/LocusZoom_Unexp/
    Untracked:  data/LocusZoom_proc/
    Untracked:  data/MatchedSnps/
    Untracked:  data/NuclearApaQTLs.txt
    Untracked:  data/PeakCounts/
    Untracked:  data/PeakCounts_noMP_5perc/
    Untracked:  data/PeakCounts_noMP_genelocanno/
    Untracked:  data/PeakUsage/
    Untracked:  data/PeakUsage_noMP/
    Untracked:  data/PeakUsage_noMP_GeneLocAnno/
    Untracked:  data/PeaksUsed/
    Untracked:  data/PeaksUsed_noMP_5percCov/
    Untracked:  data/PolyA_DB/
    Untracked:  data/QTL_overlap/
    Untracked:  data/RNAkalisto/
    Untracked:  data/RefSeq_annotations/
    Untracked:  data/Replicates_usage/
    Untracked:  data/TotalApaQTLs.txt
    Untracked:  data/Totalpeaks_filtered_clean.bed
    Untracked:  data/UnderstandPeaksQC/
    Untracked:  data/WASP_STAT/
    Untracked:  data/YL-SP-18486-T-combined-genecov.txt
    Untracked:  data/YL-SP-18486-T_S9_R1_001-genecov.txt
    Untracked:  data/YL_QTL_test/
    Untracked:  data/apaExamp/
    Untracked:  data/apaExamp_proc/
    Untracked:  data/apaQTL_examp_noMP/
    Untracked:  data/bedgraph_peaks/
    Untracked:  data/bin200.5.T.nuccov.bed
    Untracked:  data/bin200.Anuccov.bed
    Untracked:  data/bin200.nuccov.bed
    Untracked:  data/clean_peaks/
    Untracked:  data/comb_map_stats.csv
    Untracked:  data/comb_map_stats.xlsx
    Untracked:  data/comb_map_stats_39ind.csv
    Untracked:  data/combined_reads_mapped_three_prime_seq.csv
    Untracked:  data/diff_iso_GeneLocAnno/
    Untracked:  data/diff_iso_proc/
    Untracked:  data/diff_iso_trans/
    Untracked:  data/eQTLs_Lietal/
    Untracked:  data/ensemble_to_genename.txt
    Untracked:  data/example_gene_peakQuant/
    Untracked:  data/explainProtVar/
    Untracked:  data/filtPeakOppstrand_cov_noMP_GeneLocAnno_5perc/
    Untracked:  data/filtered_APApeaks_merged_allchrom_refseqTrans.closest2End.bed
    Untracked:  data/filtered_APApeaks_merged_allchrom_refseqTrans.closest2End.noties.bed
    Untracked:  data/first50lines_closest.txt
    Untracked:  data/gencov.test.csv
    Untracked:  data/gencov.test.txt
    Untracked:  data/gencov_zero.test.csv
    Untracked:  data/gencov_zero.test.txt
    Untracked:  data/gene_cov/
    Untracked:  data/joined
    Untracked:  data/leafcutter/
    Untracked:  data/merged_combined_YL-SP-threeprimeseq.bg
    Untracked:  data/molPheno_noMP/
    Untracked:  data/mol_overlap/
    Untracked:  data/mol_pheno/
    Untracked:  data/nom_QTL/
    Untracked:  data/nom_QTL_opp/
    Untracked:  data/nom_QTL_trans/
    Untracked:  data/nuc6up/
    Untracked:  data/nuc_10up/
    Untracked:  data/other_qtls/
    Untracked:  data/pQTL_otherphen/
    Untracked:  data/pacbio_cov/
    Untracked:  data/peakPerRefSeqGene/
    Untracked:  data/peaks4DT/
    Untracked:  data/perm_QTL/
    Untracked:  data/perm_QTL_GeneLocAnno_noMP_5percov/
    Untracked:  data/perm_QTL_GeneLocAnno_noMP_5percov_3UTR/
    Untracked:  data/perm_QTL_diffWindow/
    Untracked:  data/perm_QTL_opp/
    Untracked:  data/perm_QTL_trans/
    Untracked:  data/perm_QTL_trans_filt/
    Untracked:  data/protAndAPAAndExplmRes.Rda
    Untracked:  data/protAndAPAlmRes.Rda
    Untracked:  data/protAndExpressionlmRes.Rda
    Untracked:  data/reads_mapped_three_prime_seq.csv
    Untracked:  data/smash.cov.results.bed
    Untracked:  data/smash.cov.results.csv
    Untracked:  data/smash.cov.results.txt
    Untracked:  data/smash_testregion/
    Untracked:  data/ssFC200.cov.bed
    Untracked:  data/temp.file1
    Untracked:  data/temp.file2
    Untracked:  data/temp.gencov.test.txt
    Untracked:  data/temp.gencov_zero.test.txt
    Untracked:  data/threePrimeSeqMetaData.csv
    Untracked:  data/threePrimeSeqMetaData55Ind.txt
    Untracked:  data/threePrimeSeqMetaData55Ind.xlsx
    Untracked:  data/threePrimeSeqMetaData55Ind_noDup.txt
    Untracked:  data/threePrimeSeqMetaData55Ind_noDup.xlsx
    Untracked:  data/threePrimeSeqMetaData55Ind_noDup_WASPMAP.txt
    Untracked:  data/threePrimeSeqMetaData55Ind_noDup_WASPMAP.xlsx
    Untracked:  output/LZ/
    Untracked:  output/deeptools_plots/
    Untracked:  output/picard/
    Untracked:  output/plots/
    Untracked:  output/qual.fig2.pdf

Unstaged changes:
    Modified:   analysis/28ind.peak.explore.Rmd
    Modified:   analysis/CompareLianoglouData.Rmd
    Modified:   analysis/NewPeakPostMP.Rmd
    Modified:   analysis/SignalSiteEnrich.Rmd
    Modified:   analysis/apaQTLoverlapGWAS.Rmd
    Modified:   analysis/cleanupdtseq.internalpriming.Rmd
    Modified:   analysis/coloc_apaQTLs_protQTLs.Rmd
    Modified:   analysis/dif.iso.usage.leafcutter.Rmd
    Modified:   analysis/diff_iso_pipeline.Rmd
    Modified:   analysis/explainpQTLs.Rmd
    Modified:   analysis/explore.filters.Rmd
    Modified:   analysis/fixBWChromNames.Rmd
    Modified:   analysis/flash2mash.Rmd
    Modified:   analysis/mispriming_approach.Rmd
    Modified:   analysis/overlapMolQTL.Rmd
    Modified:   analysis/overlapMolQTL.opposite.Rmd
    Modified:   analysis/overlap_qtls.Rmd
    Modified:   analysis/peakOverlap_oppstrand.Rmd
    Modified:   analysis/peakQCPPlots.Rmd
    Modified:   analysis/pheno.leaf.comb.Rmd
    Modified:   analysis/pipeline_55Ind.Rmd
    Modified:   analysis/swarmPlots_QTLs.Rmd
    Modified:   analysis/test.max2.Rmd
    Modified:   analysis/test.smash.Rmd
    Modified:   analysis/understandPeaks.Rmd
    Modified:   analysis/unexplainedeQTL_analysis.Rmd
    Modified:   code/Snakefile
Note that any generated files, e.g. HTML, png, CSS, etc., are not included in this status report because it is ok for generated content to have uncommitted changes.
These are the previous versions of the R Markdown and HTML files. If you’ve configured a remote Git repository (see ?wflow_git_remote), click on the hyperlinks in the table below to view them.
| File | Version | Author | Date | Message |
|---|---|---|---|---|
| Rmd | 82e761d | Briana Mittleman | 2019-03-05 | make plots |
| html | 08ca500 | Briana Mittleman | 2019-03-04 | Build site. |
| Rmd | d5d0809 | Briana Mittleman | 2019-03-04 | add analysis |
I want to explore the genes we only found 1 peak in. I want to ask if this is due to low expression or only one PAS.
library(tidyverse)── Attaching packages ──────────────────────────────────────────────────────────────────────────── tidyverse 1.2.1 ──✔ ggplot2 3.0.0 ✔ purrr 0.2.5
✔ tibble 1.4.2 ✔ dplyr 0.7.6
✔ tidyr 0.8.1 ✔ stringr 1.4.0
✔ readr 1.1.1 ✔ forcats 0.3.0Warning: package 'stringr' was built under R version 3.5.2── Conflicts ─────────────────────────────────────────────────────────────────────────────── tidyverse_conflicts() ──
✖ dplyr::filter() masks stats::filter()
✖ dplyr::lag() masks stats::lag()library(cowplot)
Attaching package: 'cowplot'The following object is masked from 'package:ggplot2':
ggsavelibrary(reshape2)
Attaching package: 'reshape2'The following object is masked from 'package:tidyr':
smithslibrary(workflowr)This is workflowr version 1.2.0
Run ?workflowr for help getting startedThese are all of the peaks with 1 peak after accounts for 5% usage filter. This means there are many and they are rarely used.
allPeaks_1peak=read.table("../data/PeaksUsed_noMP_5percCov/Filtered_APApeaks_merged_allchrom_noMP.sort.named.noCHR_geneLocParsed.5percCov.bed", stringsAsFactors = F, col.names = c("chr", 'start','end', 'id', 'score', 'strand')) %>% separate(id, into=c("gene", "peak"), sep=":")%>% group_by(gene) %>% mutate(nPeaks=n()) %>% filter(nPeaks==1)
OnePeak_genes=allPeaks_1peak$gene

allPeaks_not1peak=read.table("../data/PeaksUsed_noMP_5percCov/Filtered_APApeaks_merged_allchrom_noMP.sort.named.noCHR_geneLocParsed.5percCov.bed", stringsAsFactors = F, col.names = c("chr", 'start','end', 'id', 'score', 'strand')) %>% separate(id, into=c("gene", "peak"), sep=":")%>% group_by(gene) %>% mutate(nPeaks=n()) %>% filter(nPeaks != 1)
MultPeak_genes=allPeaks_not1peak$gene %>% unique()

#dataframe with yes/no
allPeak=read.table("../data/PeaksUsed_noMP_5percCov/Filtered_APApeaks_merged_allchrom_noMP.sort.named.noCHR_geneLocParsed.5percCov.bed", stringsAsFactors = F, col.names = c("chr", 'start','end', 'id', 'score', 'strand')) %>% separate(id, into=c("gene", "peak"), sep=":")%>% group_by(gene) %>% summarise(nPeaks=n()) %>% mutate(PeakVar=ifelse(nPeaks==1, "1 Peak", "more peaks"))
Now I need to look at the coverage for these peaks.
This is the feature counts I performed in the diff iso analysis and has the total and nuclear libraries. I can just get the mean accross all libraries per peak then add these up.
Get row means:
counts=read.table("../data/PeakCounts_noMP_genelocanno/filtered_APApeaks_merged_allchrom_refseqGenes.GeneLocAnno_sm_quant_processed_fixed.fc",header = T, stringsAsFactors = F) %>% select(-Geneid, -Chr, -Start, -End, -Strand, -Length)
counts_mean=rowMeans(counts)
anno=read.table("../data/PeakCounts_noMP_genelocanno/filtered_APApeaks_merged_allchrom_refseqGenes.GeneLocAnno_sm_quant_processed_fixed.fc",header = T, stringsAsFactors = F) %>% select(Geneid, Chr, Start, End, Strand, Length)

countsWAnno=as.data.frame(cbind(anno,counts_mean)) %>% select(-Chr, -Start, -End,-Strand, -Length) %>% separate(Geneid, into=c("peak", "chr", "start", "end ", "strand", "gene"), sep=":") %>% group_by(gene) %>% summarise(geneCount=sum(counts_mean))
I can join this with the number of peaks:
allPeak_wGeneCount=allPeak %>% inner_join(countsWAnno, by="gene")First plot the number of peaks vs the counts. then i can look at the difference between genes with one peak vs multiple
allPeak_wGeneCount$nPeaks=as.numeric(allPeak_wGeneCount$nPeaks)


ggplot(allPeak_wGeneCount, aes(x=nPeaks,y=log(geneCount))) + geom_point()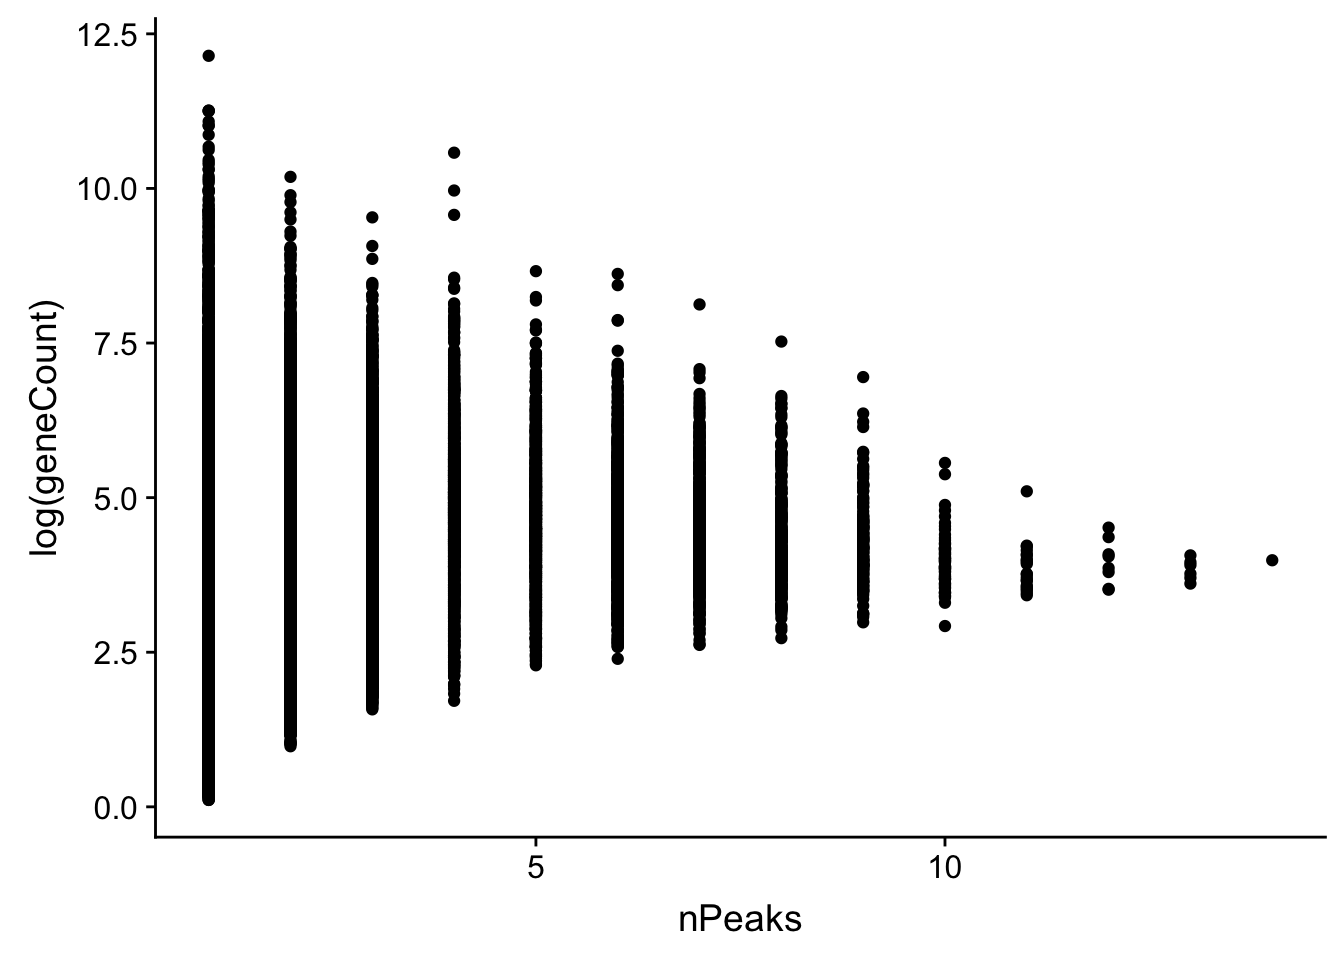
ggplot(allPeak_wGeneCount, aes(x=PeakVar, y=log(geneCount),by=PeakVar)) + geom_violin()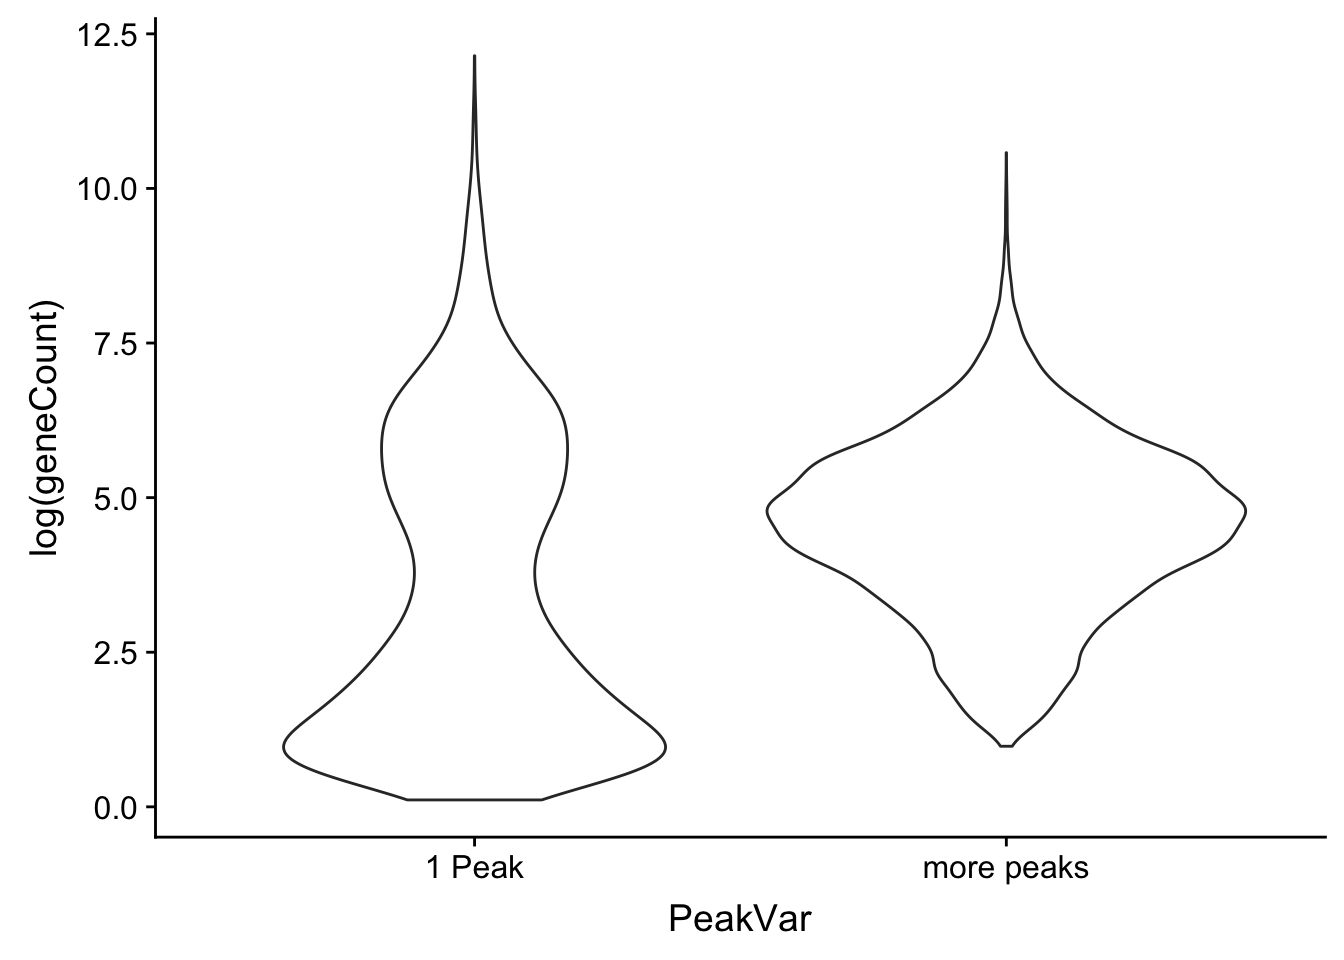 Look at the distributions:
ggplot(allPeak_wGeneCount, aes(x=log(geneCount),by=PeakVar,fill=PeakVar)) + geom_density(alpha=.3) + labs(title="Gene sum of mean peak read counts\n separated by genes with 1 vs. mult PAS")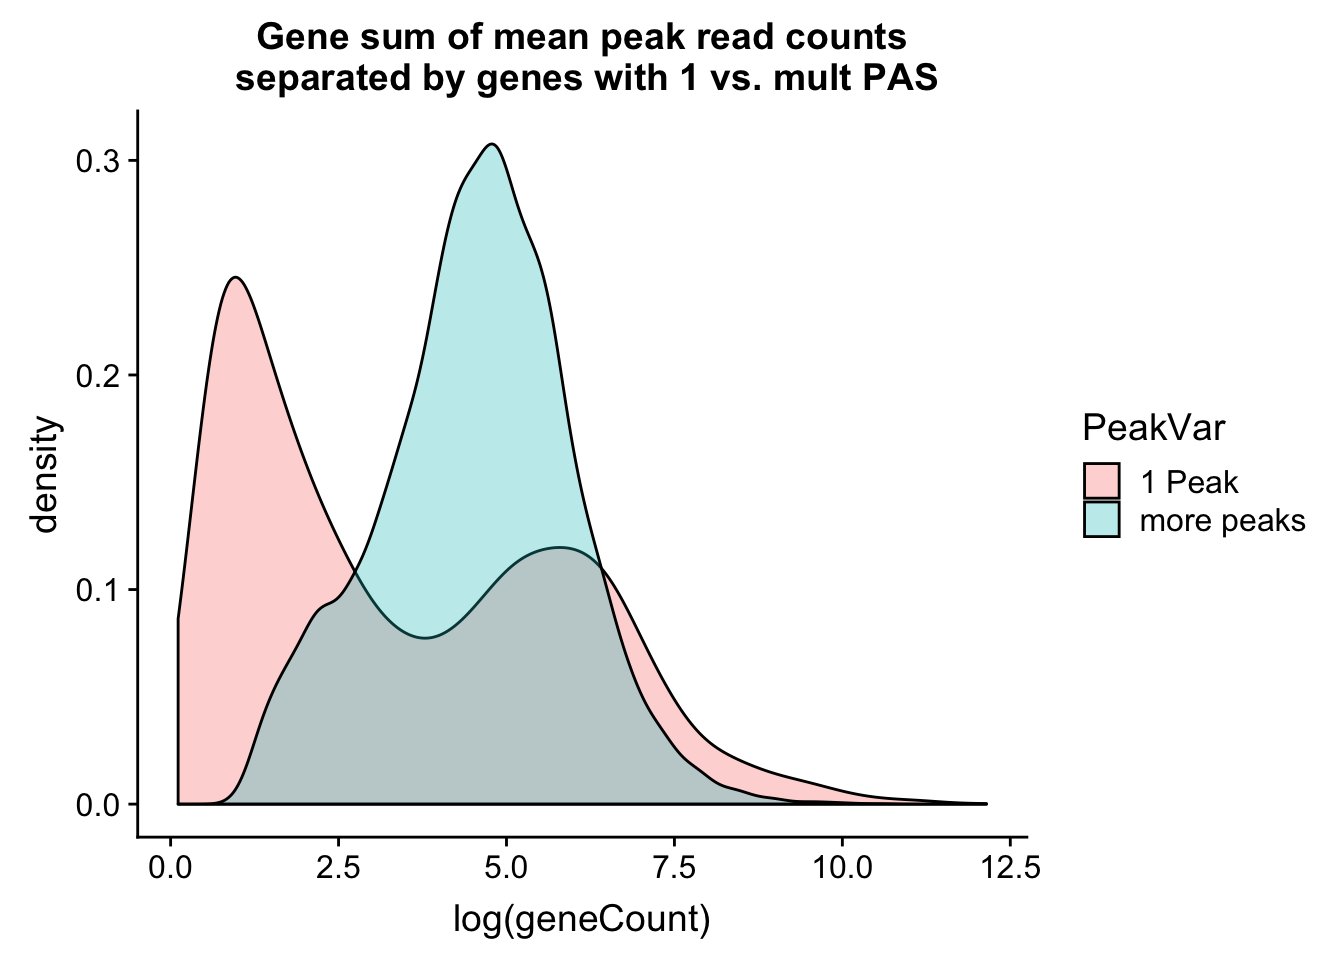
This is interesting. It shows a bimodal distribution for the genes with 1 peak. The first peak is most likely genes that we do not have enough coverage to know if there are more than one PAS and the second peak in the distribution is genes that actually only have 1 PAS.
historgram will help me understand more about the number in each group.
ggplot(allPeak_wGeneCount, aes(x=log10(geneCount),by=PeakVar,fill=PeakVar)) + geom_histogram(alpha=.3,bins=100) + labs(y="Number of Genes",title="Historgram of gene sum of mean peak read counts\n separated by genes with 1 vs. mult PAS")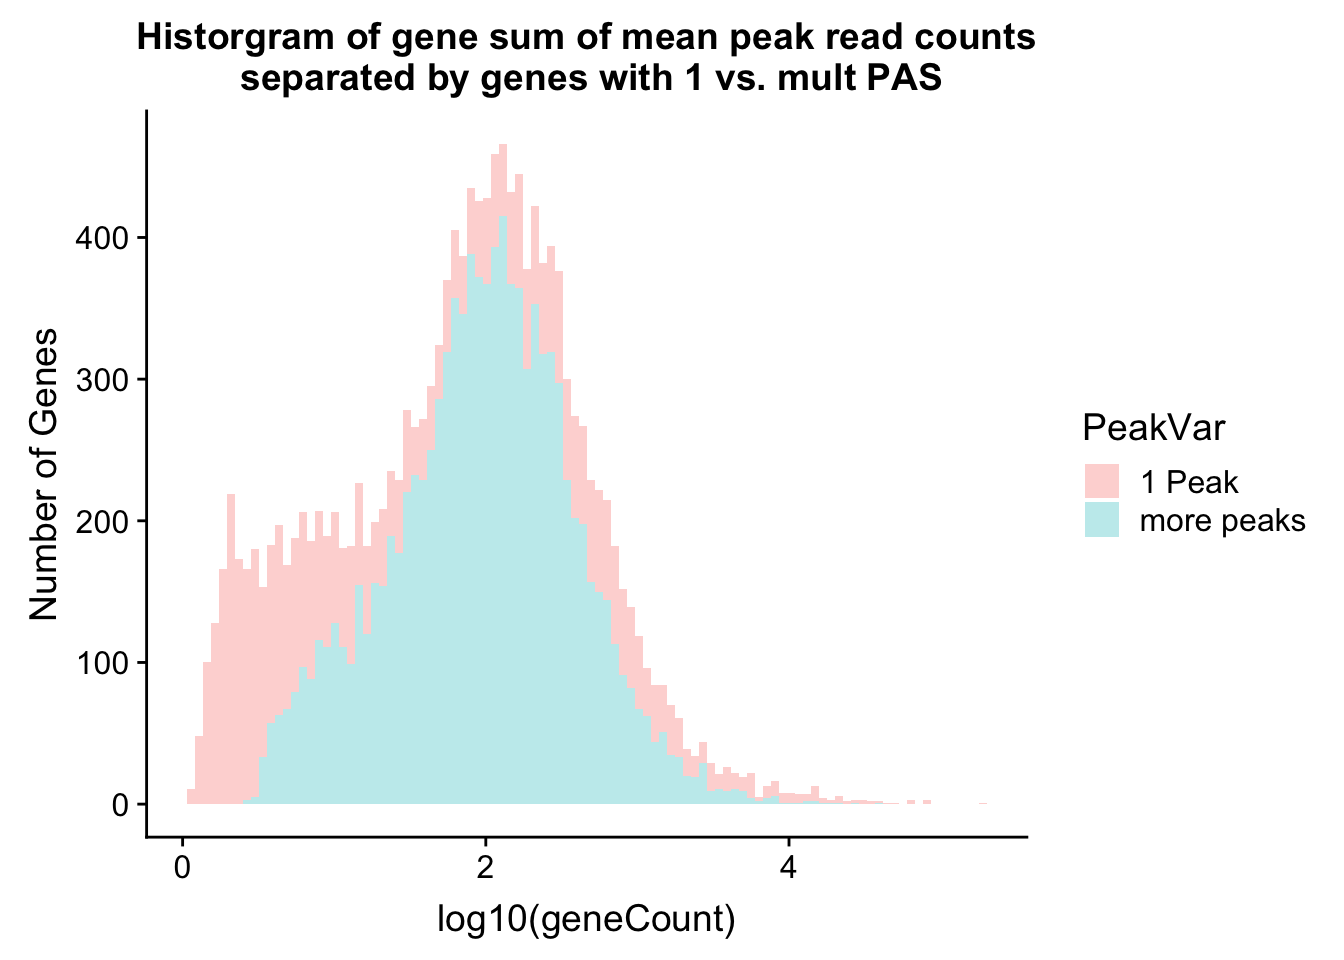
how many in each group:
allPeak_wGeneCount %>% filter(PeakVar=="1 Peak") %>% nrow[1] 4909allPeak_wGeneCount %>% filter(PeakVar=="more peaks") %>% nrow[1] 10310I can look at the PAS database annotation for n peaks. The data comes from the PolyA_DB.
problem: data is not a nice dataframe.
#DataBasePolyA=read.table("../data/PolyA_DB/clusters_withTissueInfo.bed", header = F, stringsAsFactors = F, sep="\t")I need to parse this for the sites in LCLs. annotation for this is B_LCL_cells in the 9th column.
Do this interactivly
#python

inAnno="/project2/gilad/briana/threeprimeseq/data/PolyA_DB/clusters_withTissueInfo.bed"
outAnno=open("/project2/gilad/briana/threeprimeseq/data/PolyA_DB/clusters_LCL.bed","w")


for ln in open(inAnno, "r"):
    geneList=ln.split()[8].split(";")
    if "B_LCL_cells" in geneList:
        outAnno.write(ln)

outAnno.close()
DataBasePolyA_LCL=read.table("../data/PolyA_DB/clusters_LCL.bed", header = F, stringsAsFactors = F, sep="\t", col.names =c("chr", "start", "end", "id", "score", "strand", "signal", "gene", "tissues")) %>% group_by(gene) %>% summarise(nPeaksinDB=n())Join this with my data:
allPeak_wGeneCount_withDB=allPeak_wGeneCount %>% inner_join(DataBasePolyA_LCL, by="gene")Only overlap 10498 of my 15219 genes.
Explore the relationship:
ggplot(allPeak_wGeneCount_withDB, aes(x=nPeaks, y=nPeaksinDB)) + geom_point()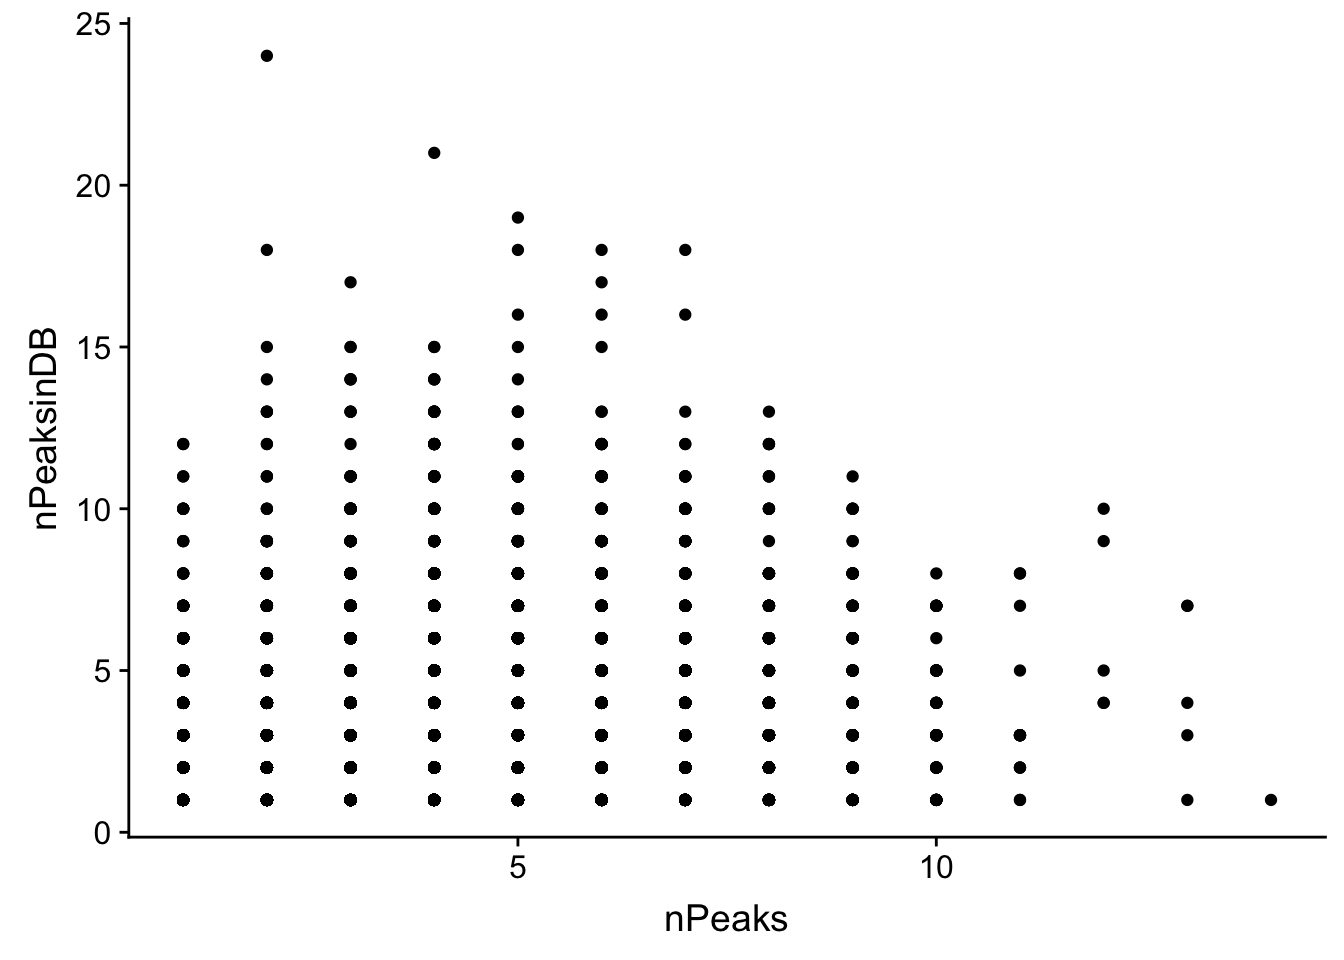
summary(lm(data=allPeak_wGeneCount_withDB, nPeaks~nPeaksinDB))
Call:
lm(formula = nPeaks ~ nPeaksinDB, data = allPeak_wGeneCount_withDB)

Residuals:
    Min      1Q  Median      3Q     Max
-8.5127 -1.6797 -0.6797  1.2552 11.3203

Coefficients:
            Estimate Std. Error t value Pr(>|t|)
(Intercept) 2.339145   0.031181   75.02   <2e-16 ***
nPeaksinDB  0.340563   0.008733   39.00   <2e-16 ***
---
Signif. codes:  0 '***' 0.001 '**' 0.01 '*' 0.05 '.' 0.1 ' ' 1

Residual standard error: 1.981 on 10496 degrees of freedom
Multiple R-squared:  0.1266,    Adjusted R-squared:  0.1265
F-statistic:  1521 on 1 and 10496 DF,  p-value: < 2.2e-16
It doesnt look like the overlap here is great but ill subset for genes in my file with only 1 peak
allPeak_wGeneCount_withDB_1peak=allPeak_wGeneCount_withDB %>% filter(nPeaks==1)


nrow(allPeak_wGeneCount_withDB_1peak)
[1] 2612There are only 2612 genes in both.
allPeak_wGeneCount_withDB= allPeak_wGeneCount_withDB %>% mutate(PeakVarDB=ifelse(nPeaksinDB==1, "1 Peak", "more peaks"))ggplot(allPeak_wGeneCount_withDB,aes(x=log(geneCount),by=PeakVarDB,fill=PeakVarDB))+ geom_density(alpha=.3) 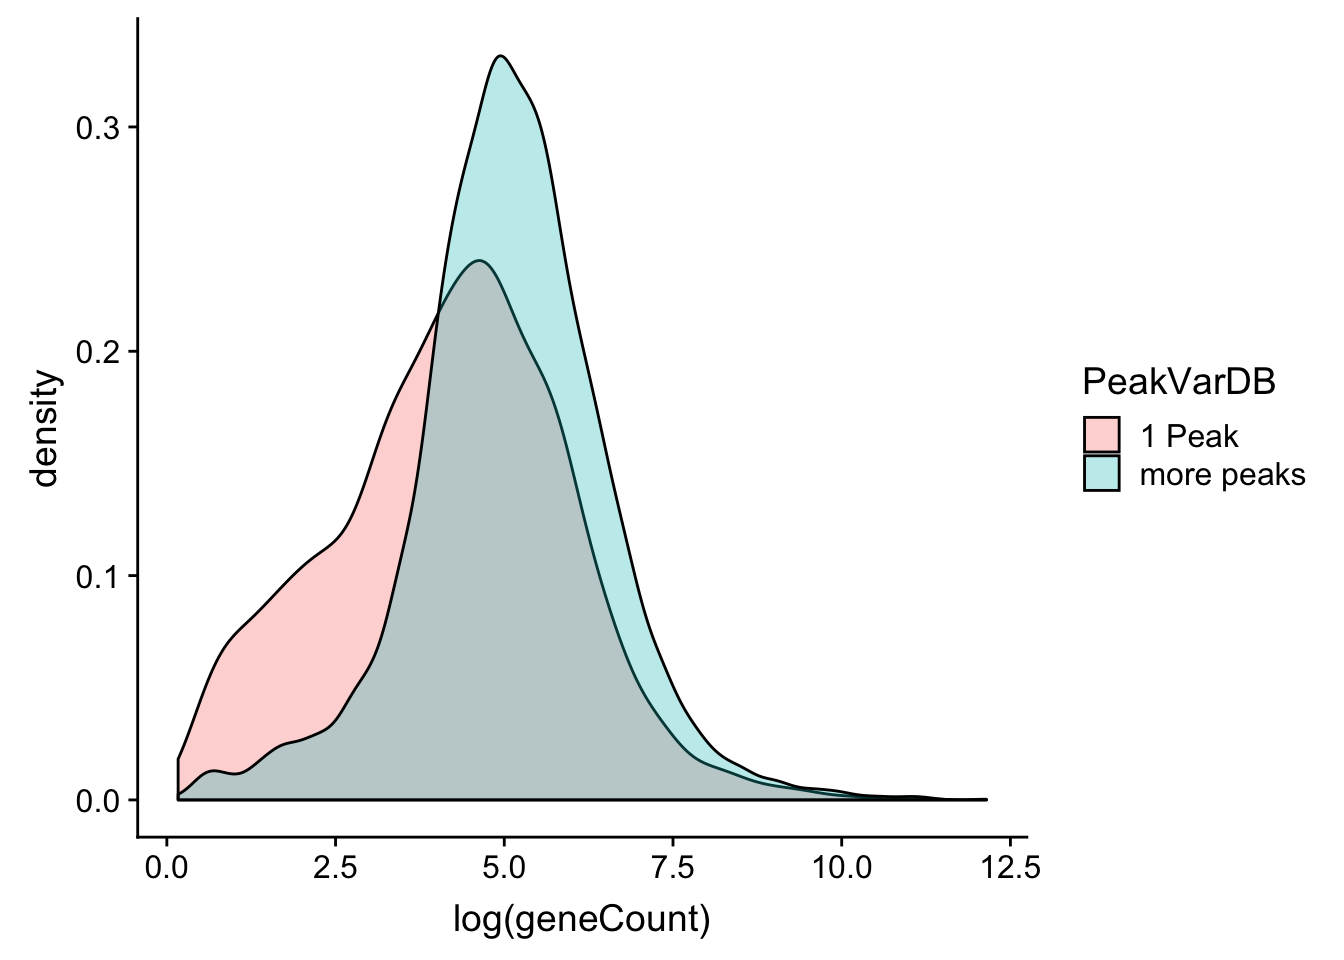
#+ facet_grid(~PeakVarDB)I want to know 1 peak in both
allPeak_wGeneCount_withDB_onpeakboth=allPeak_wGeneCount_withDB %>% filter(nPeaks==1) %>% mutate(OneBoth=ifelse(nPeaksinDB==1, "1 Both", "More in DB"))ggplot(allPeak_wGeneCount_withDB_onpeakboth,aes(x=log(geneCount),by=OneBoth,fill=OneBoth))+ geom_density(alpha=.3) + labs(title="Gene count for genes with 1 PAS in our data \n by peaks in DB") 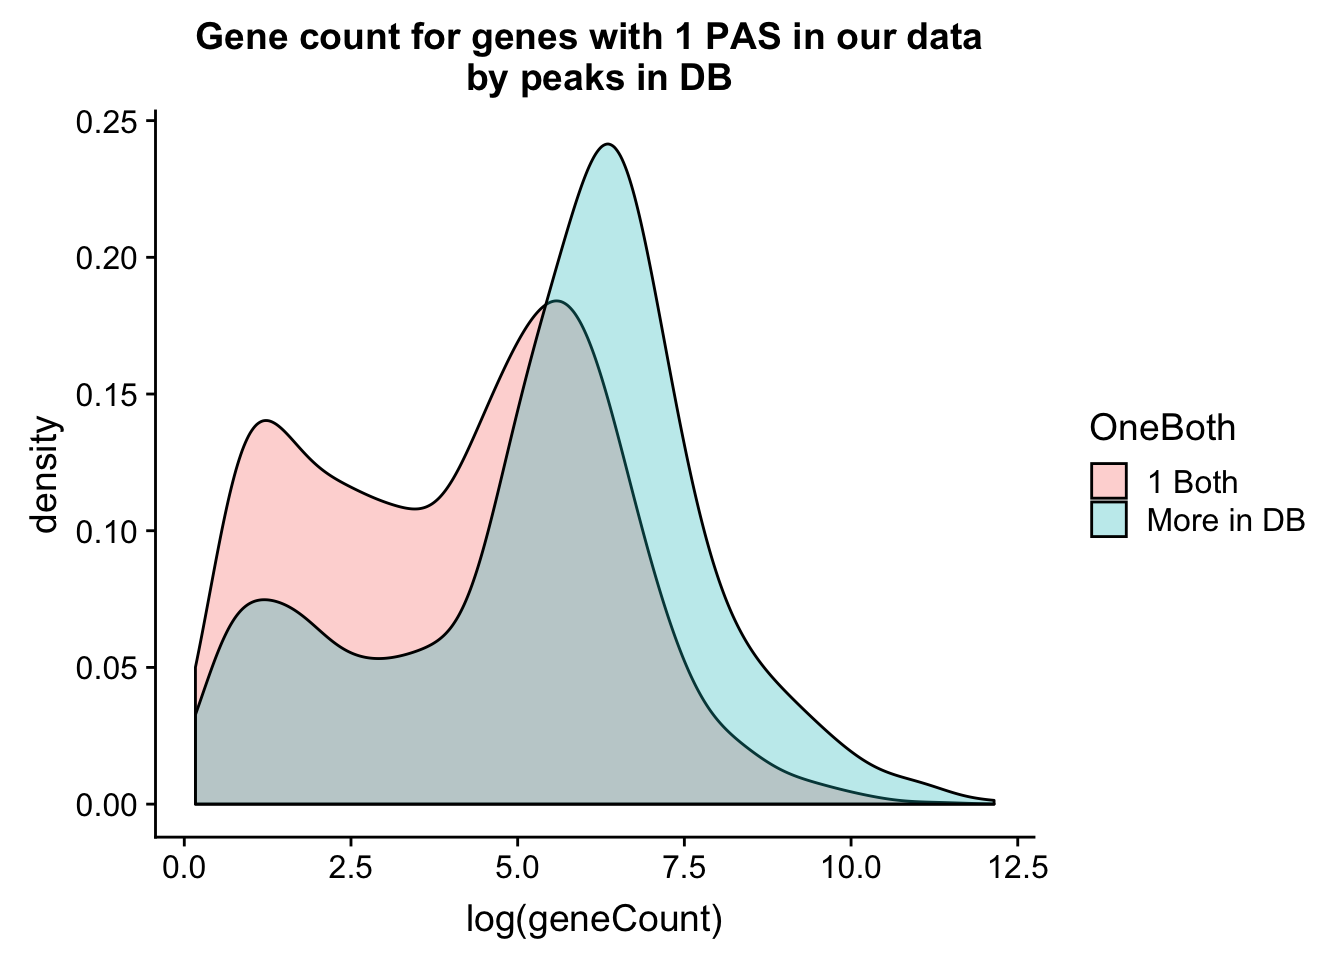 Do this as boxplots. I can see gene count for number in db.
ggplot(allPeak_wGeneCount_withDB_onpeakboth,aes(y=log(geneCount),group=nPeaksinDB, x=nPeaksinDB, fill=OneBoth))+ geom_boxplot() +labs(title="Gene count for genes with 1 PAS in our data \n by peaks in DB") 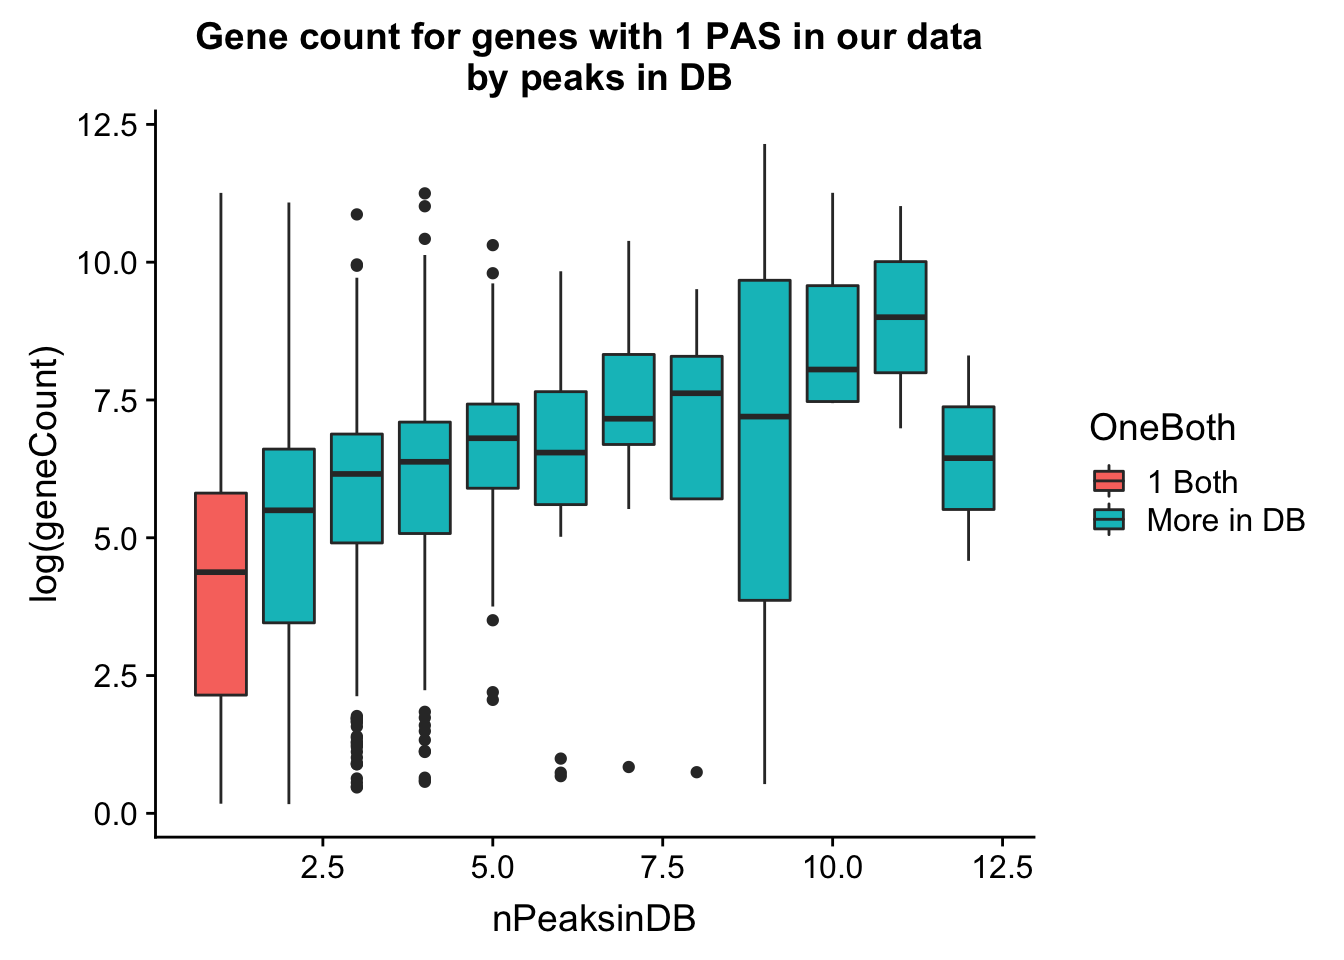
Could it be 1 peaks because the peaks are lot longer. (meaning we have multiple peaks called as 1)
allPeaks_withLength=allPeak=read.table("../data/PeaksUsed_noMP_5percCov/Filtered_APApeaks_merged_allchrom_noMP.sort.named.noCHR_geneLocParsed.5percCov.bed", stringsAsFactors = F, col.names = c("chr", 'start','end', 'id', 'score', 'strand')) %>% separate(id, into=c("gene", "peak"), sep=":")%>% group_by(gene) %>% mutate(nPeaks=n(), lengthPeak=abs(end-start)) Plot this:
ggplot(allPeaks_withLength, aes(group=nPeaks,x=nPeaks, y=log10(lengthPeak))) + geom_boxplot()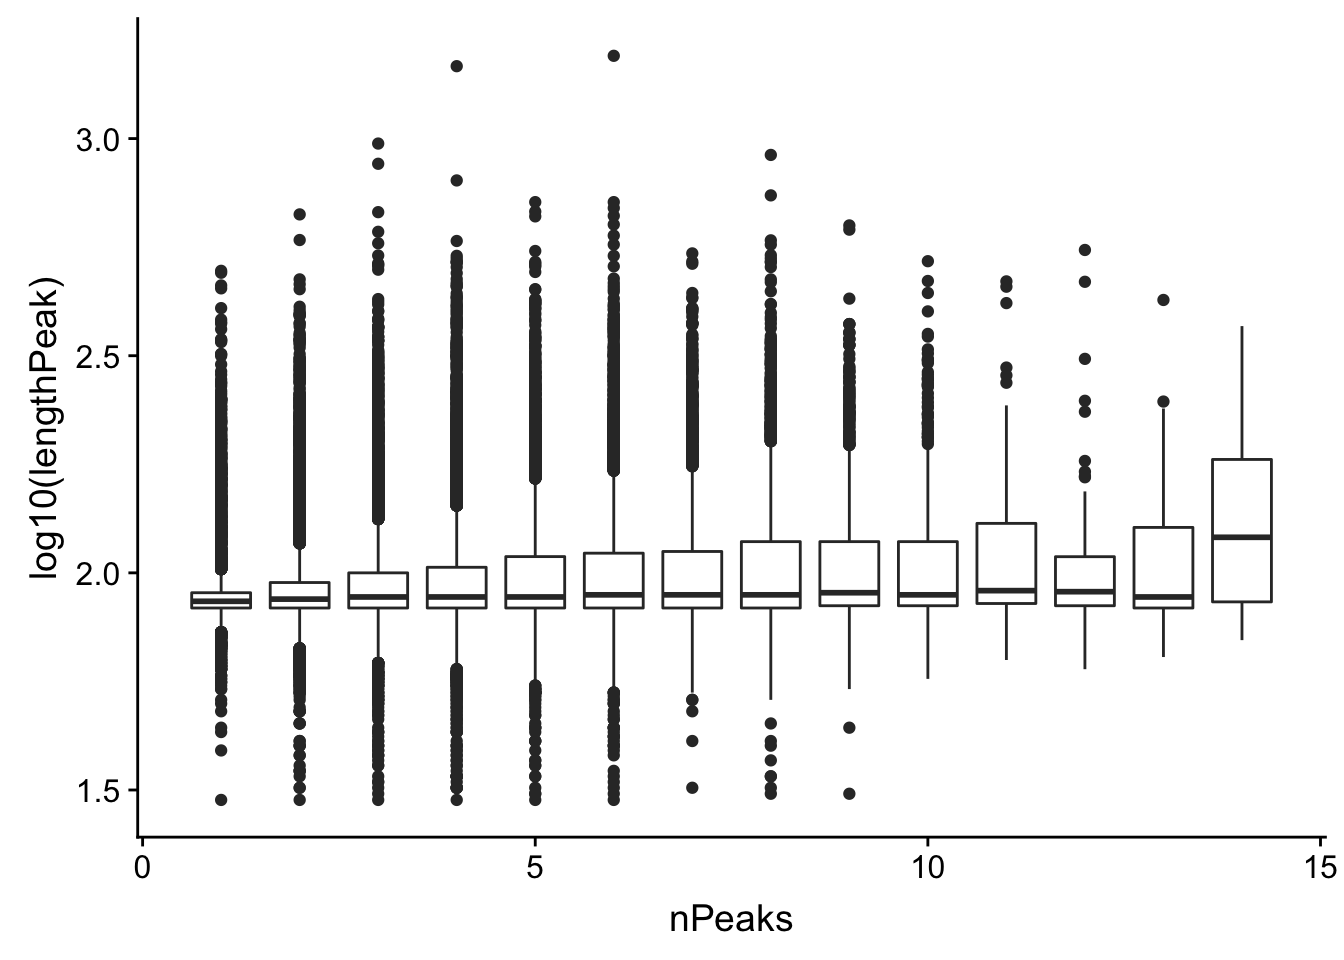
Lets make sure the genes with 1 peak and high coverage are not the long peaks. Ill join the length wuth the counts
allPeaks_withLength_sm= allPeaks_withLength %>% filter(nPeaks==1) %>% select(gene, lengthPeak)

allPeak_wGeneCount_1gene_length= allPeak_wGeneCount %>% filter(nPeaks==1) %>% inner_join(allPeaks_withLength_sm, by=c("gene"))
DOes gene count correlate with length of the peak
ggplot(allPeak_wGeneCount_1gene_length, aes(x=log10(lengthPeak), y=log10(geneCount))) + geom_point()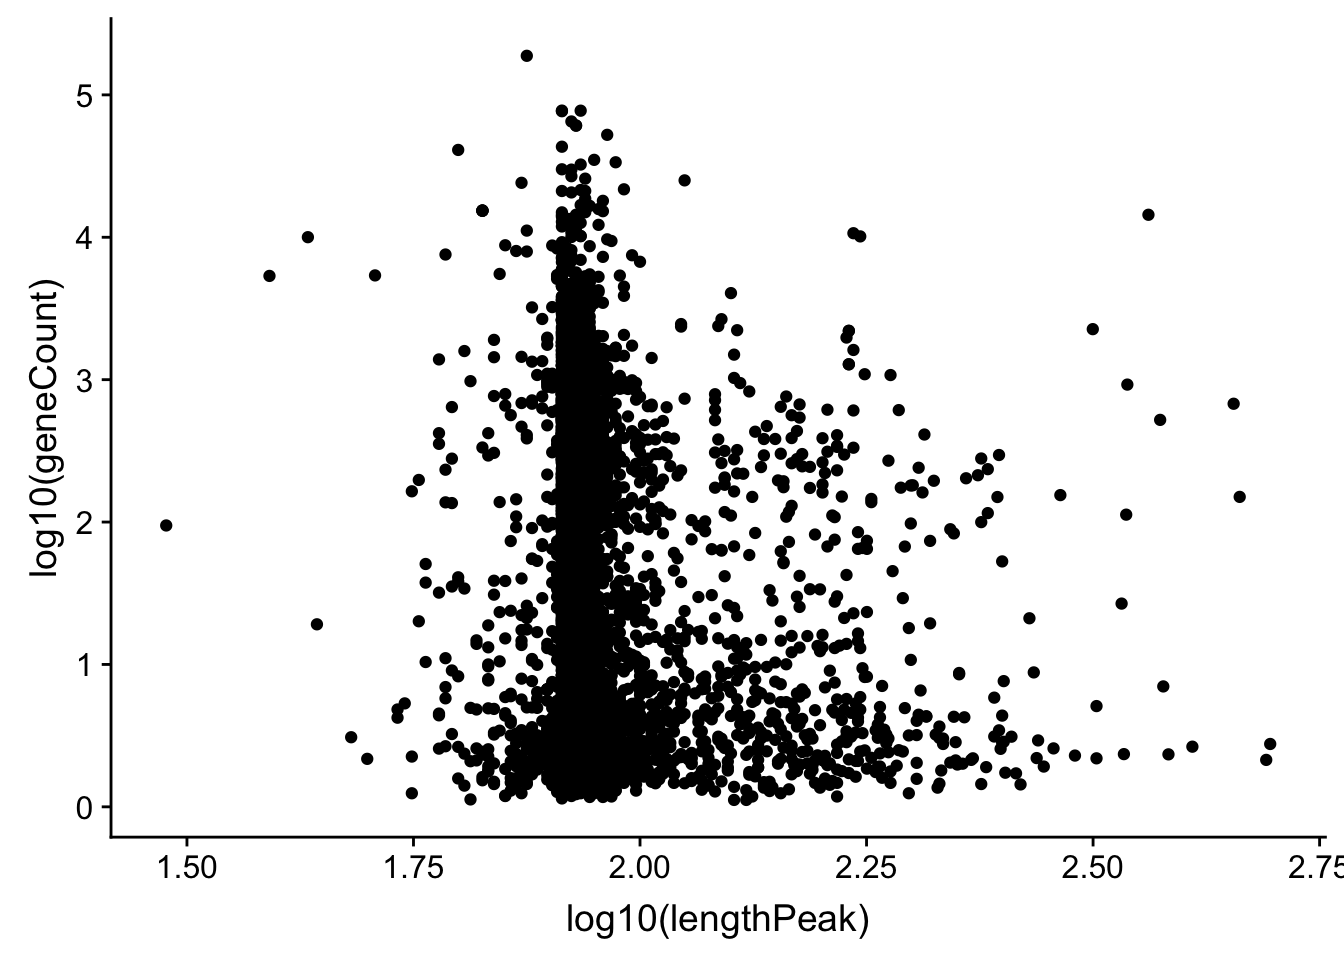
summary(lm(data=allPeak_wGeneCount_1gene_length, log10(lengthPeak) ~ log10(geneCount)))
Call:
lm(formula = log10(lengthPeak) ~ log10(geneCount), data = allPeak_wGeneCount_1gene_length)

Residuals:
     Min       1Q   Median       3Q      Max
-0.47809 -0.04227 -0.02508  0.00004  0.72402

Coefficients:
                  Estimate Std. Error t value Pr(>|t|)
(Intercept)       1.976140   0.002342 843.729   <2e-16 ***
log10(geneCount) -0.010593   0.001286  -8.239   <2e-16 ***
---
Signif. codes:  0 '***' 0.001 '**' 0.01 '*' 0.05 '.' 0.1 ' ' 1

Residual standard error: 0.09528 on 4907 degrees of freedom
Multiple R-squared:  0.01365,   Adjusted R-squared:  0.01344
F-statistic: 67.89 on 1 and 4907 DF,  p-value: < 2.2e-16
Ok it does not look like the length of the peak is driving this.
Maybe in the future we can use this analysis to get a credible set for genes with 1 PAS and explore them (are they housekeeping genes?, ect)
sessionInfo()R version 3.5.1 (2018-07-02)
Platform: x86_64-apple-darwin15.6.0 (64-bit)
Running under: macOS 10.14.1
Matrix products: default
BLAS: /Library/Frameworks/R.framework/Versions/3.5/Resources/lib/libRblas.0.dylib
LAPACK: /Library/Frameworks/R.framework/Versions/3.5/Resources/lib/libRlapack.dylib
locale:
[1] en_US.UTF-8/en_US.UTF-8/en_US.UTF-8/C/en_US.UTF-8/en_US.UTF-8
attached base packages:
[1] stats graphics grDevices utils datasets methods base
other attached packages:
[1] bindrcpp_0.2.2 workflowr_1.2.0 reshape2_1.4.3 cowplot_0.9.3
[5] forcats_0.3.0 stringr_1.4.0 dplyr_0.7.6 purrr_0.2.5
[9] readr_1.1.1 tidyr_0.8.1 tibble_1.4.2 ggplot2_3.0.0
[13] tidyverse_1.2.1
loaded via a namespace (and not attached):
[1] tidyselect_0.2.4 haven_1.1.2 lattice_0.20-35 colorspace_1.3-2
[5] htmltools_0.3.6 yaml_2.2.0 rlang_0.2.2 pillar_1.3.0
[9] glue_1.3.0 withr_2.1.2 modelr_0.1.2 readxl_1.1.0
[13] bindr_0.1.1 plyr_1.8.4 munsell_0.5.0 gtable_0.2.0
[17] cellranger_1.1.0 rvest_0.3.2 evaluate_0.13 labeling_0.3
[21] knitr_1.20 broom_0.5.0 Rcpp_0.12.19 scales_1.0.0
[25] backports_1.1.2 jsonlite_1.6 fs_1.2.6 hms_0.4.2
[29] digest_0.6.17 stringi_1.2.4 grid_3.5.1 rprojroot_1.3-2
[33] cli_1.0.1 tools_3.5.1 magrittr_1.5 lazyeval_0.2.1
[37] crayon_1.3.4 whisker_0.3-2 pkgconfig_2.0.2 xml2_1.2.0
[41] lubridate_1.7.4 assertthat_0.2.0 rmarkdown_1.11 httr_1.3.1
[45] rstudioapi_0.9.0 R6_2.3.0 nlme_3.1-137 git2r_0.24.0
[49] compiler_3.5.1