Connection between APA and RNA decay
Briana Mittleman
3/14/2019
Last updated: 2019-03-21
Checks: 6 0
Knit directory: threeprimeseq/analysis/
This reproducible R Markdown analysis was created with workflowr (version 1.2.0). The Report tab describes the reproducibility checks that were applied when the results were created. The Past versions tab lists the development history.
Great! Since the R Markdown file has been committed to the Git repository, you know the exact version of the code that produced these results.
Great job! The global environment was empty. Objects defined in the global environment can affect the analysis in your R Markdown file in unknown ways. For reproduciblity it’s best to always run the code in an empty environment.
The command set.seed(12345) was run prior to running the code in the R Markdown file. Setting a seed ensures that any results that rely on randomness, e.g. subsampling or permutations, are reproducible.
Great job! Recording the operating system, R version, and package versions is critical for reproducibility.
Nice! There were no cached chunks for this analysis, so you can be confident that you successfully produced the results during this run.
Great! You are using Git for version control. Tracking code development and connecting the code version to the results is critical for reproducibility. The version displayed above was the version of the Git repository at the time these results were generated.
Note that you need to be careful to ensure that all relevant files for the analysis have been committed to Git prior to generating the results (you can use wflow_publish or wflow_git_commit). workflowr only checks the R Markdown file, but you know if there are other scripts or data files that it depends on. Below is the status of the Git repository when the results were generated:
Ignored files:
    Ignored:    .DS_Store
    Ignored:    .Rhistory
    Ignored:    .Rproj.user/
    Ignored:    data/.DS_Store
    Ignored:    data/perm_QTL_trans_noMP_5percov/
    Ignored:    output/.DS_Store

Untracked files:
    Untracked:  KalistoAbundance18486.txt
    Untracked:  analysis/4suDataIGV.Rmd
    Untracked:  analysis/AdaptTonyExampleplots.Rmd
    Untracked:  analysis/DirectionapaQTL.Rmd
    Untracked:  analysis/EvaleQTLs.Rmd
    Untracked:  analysis/YL_QTL_test.Rmd
    Untracked:  analysis/groSeqAnalysis.Rmd
    Untracked:  analysis/ncbiRefSeq_sm.sort.mRNA.bed
    Untracked:  analysis/snake.config.notes.Rmd
    Untracked:  analysis/verifyBAM.Rmd
    Untracked:  analysis/verifybam_dubs.Rmd
    Untracked:  code/PeaksToCoverPerReads.py
    Untracked:  code/strober_pc_pve_heatmap_func.R
    Untracked:  data/18486.genecov.txt
    Untracked:  data/APApeaksYL.total.inbrain.bed
    Untracked:  data/AllPeak_counts/
    Untracked:  data/ApaQTLs/
    Untracked:  data/ApaQTLs_otherPhen/
    Untracked:  data/CTCF/
    Untracked:  data/ChromHmmOverlap/
    Untracked:  data/DistTXN2Peak_genelocAnno/
    Untracked:  data/EmpiricalDists/
    Untracked:  data/FeatureoverlapPeaks/
    Untracked:  data/GM12878.chromHMM.bed
    Untracked:  data/GM12878.chromHMM.txt
    Untracked:  data/GWAS_overlap/
    Untracked:  data/LianoglouLCL/
    Untracked:  data/LocusZoom/
    Untracked:  data/LocusZoom_Unexp/
    Untracked:  data/LocusZoom_proc/
    Untracked:  data/MatchedSnps/
    Untracked:  data/NucSpecQTL/
    Untracked:  data/NuclearApaQTLs.txt
    Untracked:  data/PeakCounts/
    Untracked:  data/PeakCounts_noMP_5perc/
    Untracked:  data/PeakCounts_noMP_genelocanno/
    Untracked:  data/PeakUsage/
    Untracked:  data/PeakUsage_noMP/
    Untracked:  data/PeakUsage_noMP_GeneLocAnno/
    Untracked:  data/PeaksUsed/
    Untracked:  data/PeaksUsed_noMP_5percCov/
    Untracked:  data/PolyA_DB/
    Untracked:  data/QTL_overlap/
    Untracked:  data/RNAdecay/
    Untracked:  data/RNAkalisto/
    Untracked:  data/RefSeq_annotations/
    Untracked:  data/Replicates_usage/
    Untracked:  data/Signal_Loc/
    Untracked:  data/TotalApaQTLs.txt
    Untracked:  data/Totalpeaks_filtered_clean.bed
    Untracked:  data/UnderstandPeaksQC/
    Untracked:  data/WASP_STAT/
    Untracked:  data/YL-SP-18486-T-combined-genecov.txt
    Untracked:  data/YL-SP-18486-T_S9_R1_001-genecov.txt
    Untracked:  data/YL_QTL_test/
    Untracked:  data/apaExamp/
    Untracked:  data/apaExamp_proc/
    Untracked:  data/apaQTL_examp_noMP/
    Untracked:  data/bedgraph_peaks/
    Untracked:  data/bin200.5.T.nuccov.bed
    Untracked:  data/bin200.Anuccov.bed
    Untracked:  data/bin200.nuccov.bed
    Untracked:  data/clean_peaks/
    Untracked:  data/comb_map_stats.csv
    Untracked:  data/comb_map_stats.xlsx
    Untracked:  data/comb_map_stats_39ind.csv
    Untracked:  data/combined_reads_mapped_three_prime_seq.csv
    Untracked:  data/diff_iso_GeneLocAnno/
    Untracked:  data/diff_iso_proc/
    Untracked:  data/diff_iso_trans/
    Untracked:  data/eQTL_inAPA/
    Untracked:  data/eQTLs_Lietal/
    Untracked:  data/ensemble_to_genename.txt
    Untracked:  data/example_gene_peakQuant/
    Untracked:  data/explainProtVar/
    Untracked:  data/filtPeakOppstrand_cov_noMP_GeneLocAnno_5perc/
    Untracked:  data/filtered_APApeaks_merged_allchrom_refseqTrans.closest2End.bed
    Untracked:  data/filtered_APApeaks_merged_allchrom_refseqTrans.closest2End.noties.bed
    Untracked:  data/first50lines_closest.txt
    Untracked:  data/gencov.test.csv
    Untracked:  data/gencov.test.txt
    Untracked:  data/gencov_zero.test.csv
    Untracked:  data/gencov_zero.test.txt
    Untracked:  data/gene_cov/
    Untracked:  data/joined
    Untracked:  data/leafcutter/
    Untracked:  data/merged_combined_YL-SP-threeprimeseq.bg
    Untracked:  data/molPheno_noMP/
    Untracked:  data/mol_overlap/
    Untracked:  data/mol_pheno/
    Untracked:  data/nom_QTL/
    Untracked:  data/nom_QTL_opp/
    Untracked:  data/nom_QTL_trans/
    Untracked:  data/nuc6up/
    Untracked:  data/nuc_10up/
    Untracked:  data/other_qtls/
    Untracked:  data/pQTL_inAPA/
    Untracked:  data/pQTL_otherphen/
    Untracked:  data/pacbio_cov/
    Untracked:  data/peakPerRefSeqGene/
    Untracked:  data/peaks4DT/
    Untracked:  data/perm_QTL/
    Untracked:  data/perm_QTL_GeneLocAnno_noMP_5percov/
    Untracked:  data/perm_QTL_GeneLocAnno_noMP_5percov_3UTR/
    Untracked:  data/perm_QTL_diffWindow/
    Untracked:  data/perm_QTL_opp/
    Untracked:  data/perm_QTL_trans/
    Untracked:  data/perm_QTL_trans_filt/
    Untracked:  data/protAndAPAAndExplmRes.Rda
    Untracked:  data/protAndAPAlmRes.Rda
    Untracked:  data/protAndExpressionlmRes.Rda
    Untracked:  data/reads_mapped_three_prime_seq.csv
    Untracked:  data/smash.cov.results.bed
    Untracked:  data/smash.cov.results.csv
    Untracked:  data/smash.cov.results.txt
    Untracked:  data/smash_testregion/
    Untracked:  data/ssFC200.cov.bed
    Untracked:  data/temp.file1
    Untracked:  data/temp.file2
    Untracked:  data/temp.gencov.test.txt
    Untracked:  data/temp.gencov_zero.test.txt
    Untracked:  data/threePrimeSeqMetaData.csv
    Untracked:  data/threePrimeSeqMetaData55Ind.txt
    Untracked:  data/threePrimeSeqMetaData55Ind.xlsx
    Untracked:  data/threePrimeSeqMetaData55Ind_noDup.txt
    Untracked:  data/threePrimeSeqMetaData55Ind_noDup.xlsx
    Untracked:  data/threePrimeSeqMetaData55Ind_noDup_WASPMAP.txt
    Untracked:  data/threePrimeSeqMetaData55Ind_noDup_WASPMAP.xlsx
    Untracked:  manuscript/
    Untracked:  output/LZ/
    Untracked:  output/deeptools_plots/
    Untracked:  output/picard/
    Untracked:  output/plots/
    Untracked:  output/qual.fig2.pdf

Unstaged changes:
    Modified:   analysis/28ind.peak.explore.Rmd
    Modified:   analysis/CompareLianoglouData.Rmd
    Modified:   analysis/HistoneModandPAS.Rmd
    Modified:   analysis/NewPeakPostMP.Rmd
    Modified:   analysis/NuclearSpecQTL.Rmd
    Modified:   analysis/PeakToXper.Rmd
    Modified:   analysis/apaQTLoverlapGWAS.Rmd
    Modified:   analysis/characterize_apaQTLs.Rmd
    Modified:   analysis/cleanupdtseq.internalpriming.Rmd
    Modified:   analysis/coloc_apaQTLs_protQTLs.Rmd
    Modified:   analysis/dif.iso.usage.leafcutter.Rmd
    Modified:   analysis/diff_iso_pipeline.Rmd
    Modified:   analysis/explainpQTLs.Rmd
    Modified:   analysis/explore.filters.Rmd
    Modified:   analysis/fixBWChromNames.Rmd
    Modified:   analysis/flash2mash.Rmd
    Modified:   analysis/initialPacBioQuant.Rmd
    Modified:   analysis/mispriming_approach.Rmd
    Modified:   analysis/overlapMolQTL.Rmd
    Modified:   analysis/overlapMolQTL.opposite.Rmd
    Modified:   analysis/overlap_qtls.Rmd
    Modified:   analysis/peakOverlap_oppstrand.Rmd
    Modified:   analysis/peakQCPPlots.Rmd
    Modified:   analysis/pheno.leaf.comb.Rmd
    Modified:   analysis/pipeline_55Ind.Rmd
    Modified:   analysis/swarmPlots_QTLs.Rmd
    Modified:   analysis/test.max2.Rmd
    Modified:   analysis/test.smash.Rmd
    Modified:   analysis/understandPeaks.Rmd
    Modified:   analysis/unexplainedeQTL_analysis.Rmd
    Modified:   code/Snakefile
Note that any generated files, e.g. HTML, png, CSS, etc., are not included in this status report because it is ok for generated content to have uncommitted changes.
These are the previous versions of the R Markdown and HTML files. If you’ve configured a remote Git repository (see ?wflow_git_remote), click on the hyperlinks in the table below to view them.
| File | Version | Author | Date | Message |
|---|---|---|---|---|
| Rmd | be9dbbf | Briana Mittleman | 2019-03-21 | add 4su ratio plots |
| html | e1baddd | Briana Mittleman | 2019-03-19 | Build site. |
| Rmd | 6e940ea | Briana Mittleman | 2019-03-19 | change color by density |
| html | 7fc93c8 | Briana Mittleman | 2019-03-18 | Build site. |
| Rmd | 52ab386 | Briana Mittleman | 2019-03-18 | look at gene 1 SD outside mean decay |
| html | 1283669 | Briana Mittleman | 2019-03-15 | Build site. |
| Rmd | 5d6ac93 | Briana Mittleman | 2019-03-15 | add decay analysis |
I want to ask if more nuclear specific transcripts compared to total is associated with RNA decay.
library(tidyverse)── Attaching packages ──────────────────────────────────────────────────────── tidyverse 1.2.1 ──✔ ggplot2 3.1.0 ✔ purrr 0.3.1
✔ tibble 2.0.1 ✔ dplyr 0.8.0.1
✔ tidyr 0.8.3 ✔ stringr 1.4.0
✔ readr 1.3.1 ✔ forcats 0.4.0 Warning: package 'tibble' was built under R version 3.5.2Warning: package 'tidyr' was built under R version 3.5.2Warning: package 'purrr' was built under R version 3.5.2Warning: package 'dplyr' was built under R version 3.5.2Warning: package 'stringr' was built under R version 3.5.2Warning: package 'forcats' was built under R version 3.5.2── Conflicts ─────────────────────────────────────────────────────────── tidyverse_conflicts() ──
✖ dplyr::filter() masks stats::filter()
✖ dplyr::lag() masks stats::lag()library(reshape2)
Attaching package: 'reshape2'The following object is masked from 'package:tidyr':
smithslibrary(MASS)
Attaching package: 'MASS'The following object is masked from 'package:dplyr':
selectlibrary(viridis)Loading required package: viridisLitedecay=read.table(file = "../data/RNAdecay/tr_decay_table_norm.txt", header=T, stringsAsFactors = F) %>% dplyr::select(gene_id,contains("RNAdecay"))Change gene names:
geneNames=read.table("../data/ensemble_to_genename.txt", sep="\t", col.names = c('gene_id', 'GeneName', 'source' ),stringsAsFactors = F)decay_geneNames=decay %>% inner_join(geneNames, by="gene_id") %>% dplyr::select(GeneName, contains("RNAdecay"))
decay_geneNames_long=melt(decay_geneNames,id.vars = "GeneName", value.name = "RNA_Decay", variable.name = "Decay_Ind") %>% separate(Decay_Ind, into=c("type", "ind"), sep="_") %>% mutate(Individual=paste("X" , ind, sep="")) %>% dplyr::select(GeneName, Individual, RNA_Decay)Prepare apa value:
For each gene I need to get nuclear counts/nuclear + counts
I want to use the filtered 5% peak counts.
/project2/gilad/briana/threeprimeseq/data/filtPeakOppstrand_cov_noMP_GeneLocAnno_5perc/filtered_APApeaks_merged_allchrom_refseqGenes.GeneLocAnno_NoMP_sm_quant.Nuclear.fixed.5perc.fc
/project2/gilad/briana/threeprimeseq/data/filtPeakOppstrand_cov_noMP_GeneLocAnno_5perc/filtered_APApeaks_merged_allchrom_refseqGenes.GeneLocAnno_NoMP_sm_quant.Total.fixed.5perc.fc
Make a dictionary from the individuals in the first line. I want them to have NA##### format
makepheno4decayComparison.py
nucCounts="/project2/gilad/briana/threeprimeseq/data/filtPeakOppstrand_cov_noMP_GeneLocAnno_5perc/filtered_APApeaks_merged_allchrom_refseqGenes.GeneLocAnno_NoMP_sm_quant.Nuclear.fixed.5perc.fc"

totCounts="/project2/gilad/briana/threeprimeseq/data/filtPeakOppstrand_cov_noMP_GeneLocAnno_5perc/filtered_APApeaks_merged_allchrom_refseqGenes.GeneLocAnno_NoMP_sm_quant.Total.fixed.5perc.fc"

#top key is individual
OutPutdic={}


#problem keeping ind connected to column
Try in R
Nuclear first:
NucAPA=read.table("../data/filtPeakOppstrand_cov_noMP_GeneLocAnno_5perc/filtered_APApeaks_merged_allchrom_refseqGenes.GeneLocAnno_NoMP_sm_quant.Nuclear.fixed.5perc.fc", stringsAsFactors = F, header = T) %>% dplyr::select(-Chr, -Start, -End, -Strand, -Length) %>% separate(Geneid, into=c("peak", "chrom", "start", "end", "strand", "GeneName"), sep=":") %>% dplyr::select(-chrom, -start, -end, -strand)

NucApaMelt=melt(NucAPA, id.vars =c( "peak", "GeneName"), value.name="count", variable.name="Ind") %>% separate(Ind, into=c('Individual', 'fraction') ,sep="_") %>% dplyr::select(peak, GeneName, Individual, count)


NucAPA_bygene= NucApaMelt %>% group_by(GeneName,Individual) %>% summarise(NuclearSum=sum(count))
Total first:
TotAPA=read.table("../data/filtPeakOppstrand_cov_noMP_GeneLocAnno_5perc/filtered_APApeaks_merged_allchrom_refseqGenes.GeneLocAnno_NoMP_sm_quant.Total.fixed.5perc.fc", stringsAsFactors = F, header = T) %>% dplyr::select(-Chr, -Start, -End, -Strand, -Length) %>% separate(Geneid, into=c("peak", "chrom", "start", "end", "strand", "GeneName"), sep=":") %>% dplyr::select(-chrom, -start, -end, -strand)

TotApaMelt=melt(TotAPA, id.vars =c( "peak", "GeneName"), value.name="count", variable.name="Ind")  %>% separate(Ind, into=c('Individual', 'fraction') ,sep="_") %>% dplyr::select(peak, GeneName, Individual, count)


TotAPA_bygene=TotApaMelt %>% group_by(GeneName,Individual) %>% summarise(TotalSum=sum(count))
Sum these together:
Apa_all=TotAPA_bygene %>% inner_join(NucAPA_bygene, by=c("GeneName", "Individual")) %>% filter(NuclearSum>0 |TotalSum>0 ) %>% mutate(APAvalue=NuclearSum/(NuclearSum+TotalSum)) %>% dplyr::select(GeneName, Individual, APAvalue)Join ith decay
APAandDecay=decay_geneNames_long %>% inner_join(Apa_all, by=c('GeneName', 'Individual'))


ngenes=APAandDecay %>% dplyr::select(GeneName) %>% unique() %>% nrow()
ngenes
[1] 7888plot it:
summary(lm(data=APAandDecay, APAvalue~RNA_Decay))
Call:
lm(formula = APAvalue ~ RNA_Decay, data = APAandDecay)

Residuals:
     Min       1Q   Median       3Q      Max
-0.46459 -0.15044 -0.01135  0.13392  0.58497

Coefficients:
              Estimate Std. Error t value Pr(>|t|)
(Intercept)  0.4373568  0.0003228 1354.83   <2e-16 ***
RNA_Decay   -0.0257699  0.0019255  -13.38   <2e-16 ***
---
Signif. codes:  0 '***' 0.001 '**' 0.01 '*' 0.05 '.' 0.1 ' ' 1

Residual standard error: 0.2017 on 398991 degrees of freedom
Multiple R-squared:  0.0004487, Adjusted R-squared:  0.0004462
F-statistic: 179.1 on 1 and 398991 DF,  p-value: < 2.2e-16
APAdecalAllindplot=ggplot(APAandDecay, aes(y=APAvalue, x=RNA_Decay)) + geom_point(aes(col=Individual)) +geom_density2d(na.rm = TRUE, size = 1, colour = 'red') + geom_smooth(method="lm") + annotate("text", label="Estimated Slope= -.026", y=1, x=-1) + labs(title="Relationship between RNA decay \nand APA fraction counts", x=" mRNA decay rate/h", y= "Nuclear/(Nuclear + Total)")
APAdecalAllindplot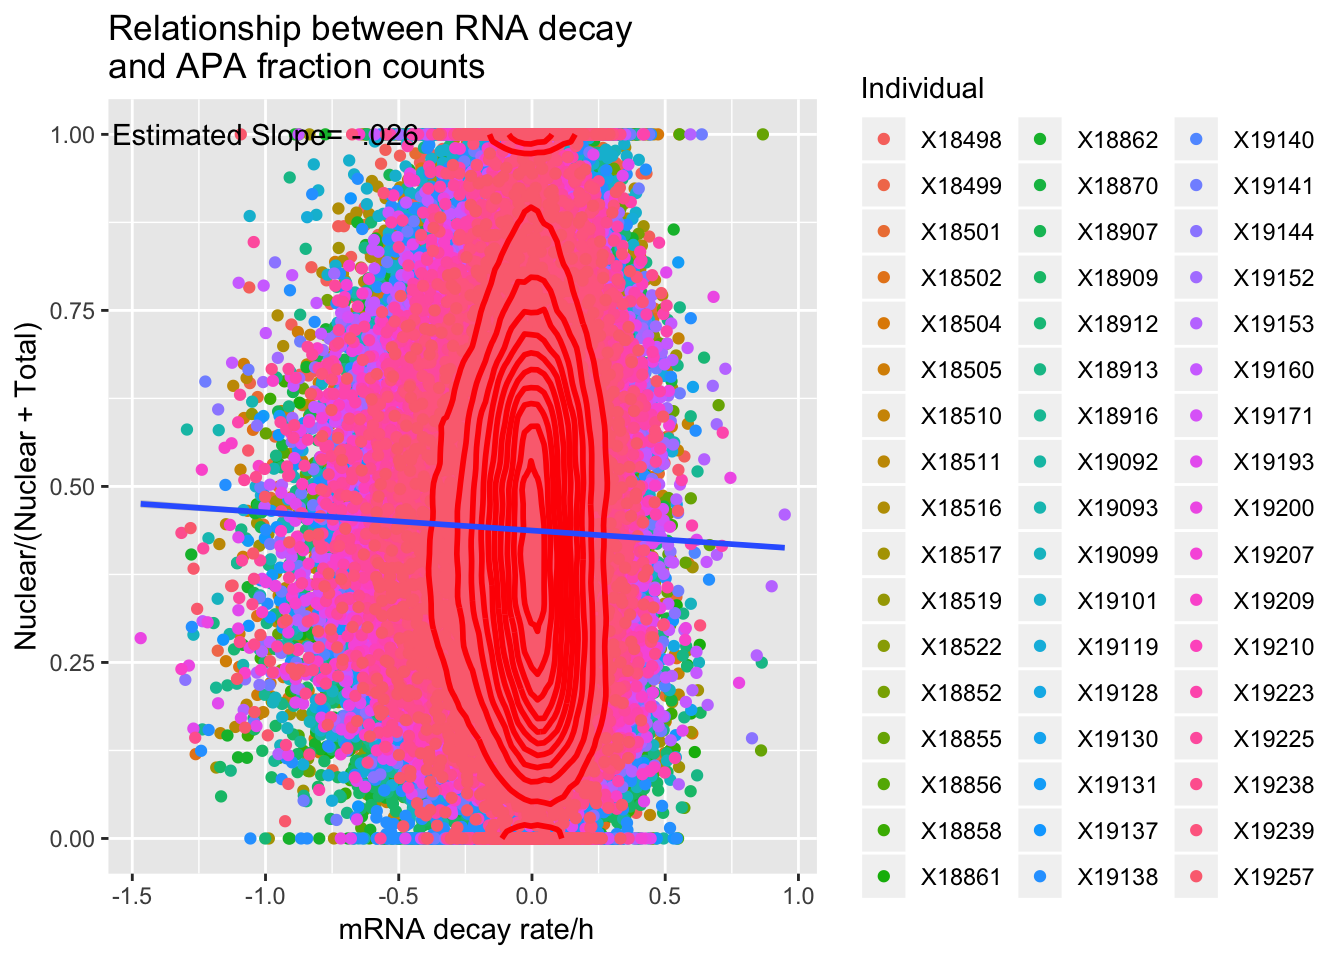
| Version | Author | Date |
|---|---|---|
| 1283669 | Briana Mittleman | 2019-03-15 |
ggsave(APAdecalAllindplot, file="../output/plots/APAandRNADecay_allInd.png", height = 7, width=15)1 individual:
APAandDecay_18498= APAandDecay %>% filter(Individual=="X18498")

APAdecay_18498=ggplot(APAandDecay_18498, aes(y=APAvalue, x=RNA_Decay)) + geom_point() +geom_density2d(na.rm = TRUE, size = 1, colour = 'red') + annotate("text", label="Estimated Slope= -.133", y=0, x=-.8) + geom_smooth(method="lm")+ labs(title="Relationship between RNA decay \nand APA fraction counts", x=" mRNA decay rate/h", y= "Nuclear/(Nuclear + Total)")


APAdecay_18498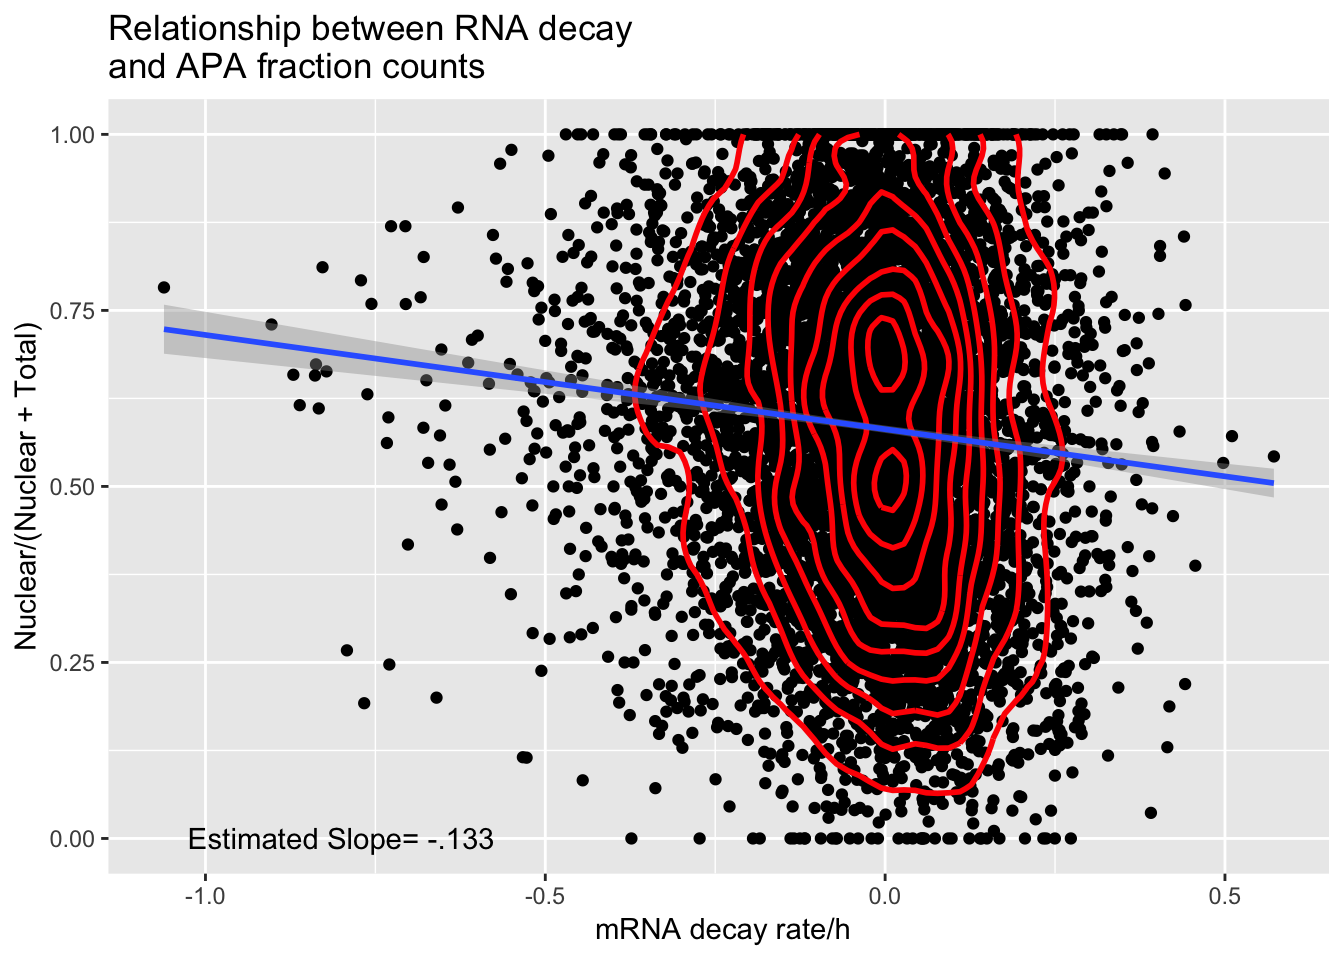
| Version | Author | Date |
|---|---|---|
| 1283669 | Briana Mittleman | 2019-03-15 |
ggsave(APAdecay_18498, file="../output/plots/APAandRNADecay_18498.png")Saving 7 x 5 in imagesummary(lm(data=APAandDecay_18498, APAvalue~RNA_Decay))
Call:
lm(formula = APAvalue ~ RNA_Decay, data = APAandDecay_18498)

Residuals:
     Min       1Q   Median       3Q      Max
-0.63123 -0.17159  0.00659  0.17479  0.47142

Coefficients:
             Estimate Std. Error t value Pr(>|t|)
(Intercept)  0.581252   0.002667 217.933  < 2e-16 ***
RNA_Decay   -0.133867   0.016938  -7.903 3.09e-15 ***
---
Signif. codes:  0 '***' 0.001 '**' 0.01 '*' 0.05 '.' 0.1 ' ' 1

Residual standard error: 0.2324 on 7766 degrees of freedom
Multiple R-squared:  0.007979,  Adjusted R-squared:  0.007851
F-statistic: 62.46 on 1 and 7766 DF,  p-value: 3.094e-15
Look at most variable decay values
Most of the genes have a similar decay rate. To se if there is a trend I need to look at the genes with >1sd outside of the mean.
decay_zscore=decay_geneNames_long  %>% mutate(mean=mean(RNA_Decay), sd=sd(RNA_Decay)) %>%  group_by(GeneName) %>% mutate(geneMean=mean(RNA_Decay)) %>% mutate(Zscore=(geneMean-mean)/sd) %>% dplyr::select(GeneName, Zscore) %>% unique()


decay_1sd= decay_zscore %>% filter(abs(Zscore)>1) %>% dplyr::select(GeneName)
Filter the apa and decay for these genes.
APAandDecay_1sd= APAandDecay %>% filter(GeneName %in% decay_1sd$GeneName)

APAandDecay_1sd %>% dplyr::select(GeneName) %>% unique() %>% nrow()
[1] 938summary(lm(data=APAandDecay_1sd, APAvalue~RNA_Decay))
Call:
lm(formula = APAvalue ~ RNA_Decay, data = APAandDecay_1sd)

Residuals:
     Min       1Q   Median       3Q      Max
-0.47225 -0.13964 -0.01415  0.12495  0.63026

Coefficients:
             Estimate Std. Error t value Pr(>|t|)
(Intercept)  0.396160   0.001103  359.08   <2e-16 ***
RNA_Decay   -0.072001   0.003283  -21.93   <2e-16 ***
---
Signif. codes:  0 '***' 0.001 '**' 0.01 '*' 0.05 '.' 0.1 ' ' 1

Residual standard error: 0.1868 on 47713 degrees of freedom
Multiple R-squared:  0.009982,  Adjusted R-squared:  0.009962
F-statistic: 481.1 on 1 and 47713 DF,  p-value: < 2.2e-16
get_density <- function(x, y, ...) {
dens <- MASS::kde2d(x, y, ...)
ix <- findInterval(x, dens$x)
iy <- findInterval(y, dens$y)
ii <- cbind(ix, iy)
return(dens$z[ii])
}
set.seed(1)
dat <- data.frame(
x = c(
rnorm(1e4, mean = 0, sd = 0.1),
rnorm(1e3, mean = 0, sd = 0.1)
),
y = c(
rnorm(1e4, mean = 0, sd = 0.1),
rnorm(1e3, mean = 0.1, sd = 0.2)
)
)
APAandDecay_1sd$density <- get_density(APAandDecay_1sd$APAvalue, APAandDecay_1sd$RNA_Decay, n = 100)
APAdecalAllindplot_zgreat1=ggplot(APAandDecay_1sd, aes(y=APAvalue, x=RNA_Decay)) + geom_point(aes(color=density))+ geom_smooth(method="lm")+ labs(title="Relationship between RNA decay \nand APA fraction counts", x=" mRNA decay rate/h", y= "Nuclear/(Nuclear + Total)") + scale_color_viridis()
APAdecalAllindplot_zgreat1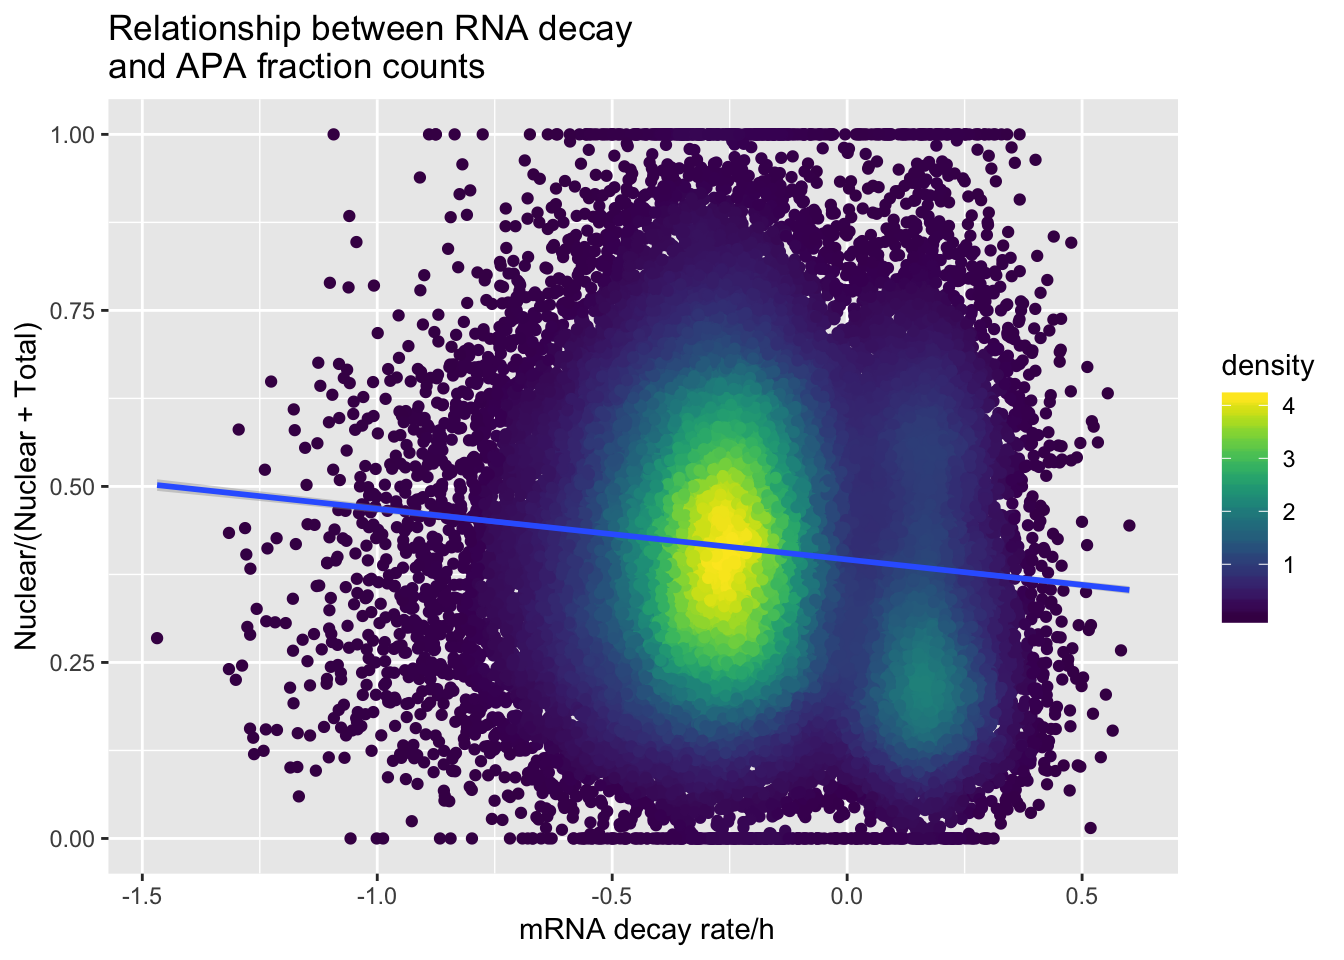
ggsave(APAdecalAllindplot_zgreat1, file="../output/plots/APAandRNADecay1SD_allInd.png", height = 7, width=7)APAandDecay1SD_18498= APAandDecay_1sd %>% filter(Individual=="X18498")
APAandDecay1SD_18498$density <- get_density(APAandDecay1SD_18498$APAvalue, APAandDecay1SD_18498$RNA_Decay, n = 100)
APAdecay1sqd_18498=ggplot(APAandDecay1SD_18498, aes(y=APAvalue, x=RNA_Decay)) + geom_point(aes(color=density)) +geom_smooth(method="lm")+ labs(title="Relationship between RNA decay \nand APA fraction counts", x=" mRNA decay rate/h", y= "Nuclear/(Nuclear + Total)") + scale_color_viridis()
summary(lm(data=APAandDecay1SD_18498, APAvalue~RNA_Decay))
Call:
lm(formula = APAvalue ~ RNA_Decay, data = APAandDecay1SD_18498)

Residuals:
     Min       1Q   Median       3Q      Max
-0.55209 -0.15612  0.00324  0.15925  0.53943

Coefficients:
             Estimate Std. Error t value Pr(>|t|)
(Intercept)  0.527434   0.009106  57.923  < 2e-16 ***
RNA_Decay   -0.240981   0.029133  -8.272 4.56e-16 ***
---
Signif. codes:  0 '***' 0.001 '**' 0.01 '*' 0.05 '.' 0.1 ' ' 1

Residual standard error: 0.2203 on 928 degrees of freedom
Multiple R-squared:  0.06867,   Adjusted R-squared:  0.06766
F-statistic: 68.42 on 1 and 928 DF,  p-value: 4.556e-16
APAdecay1sqd_18498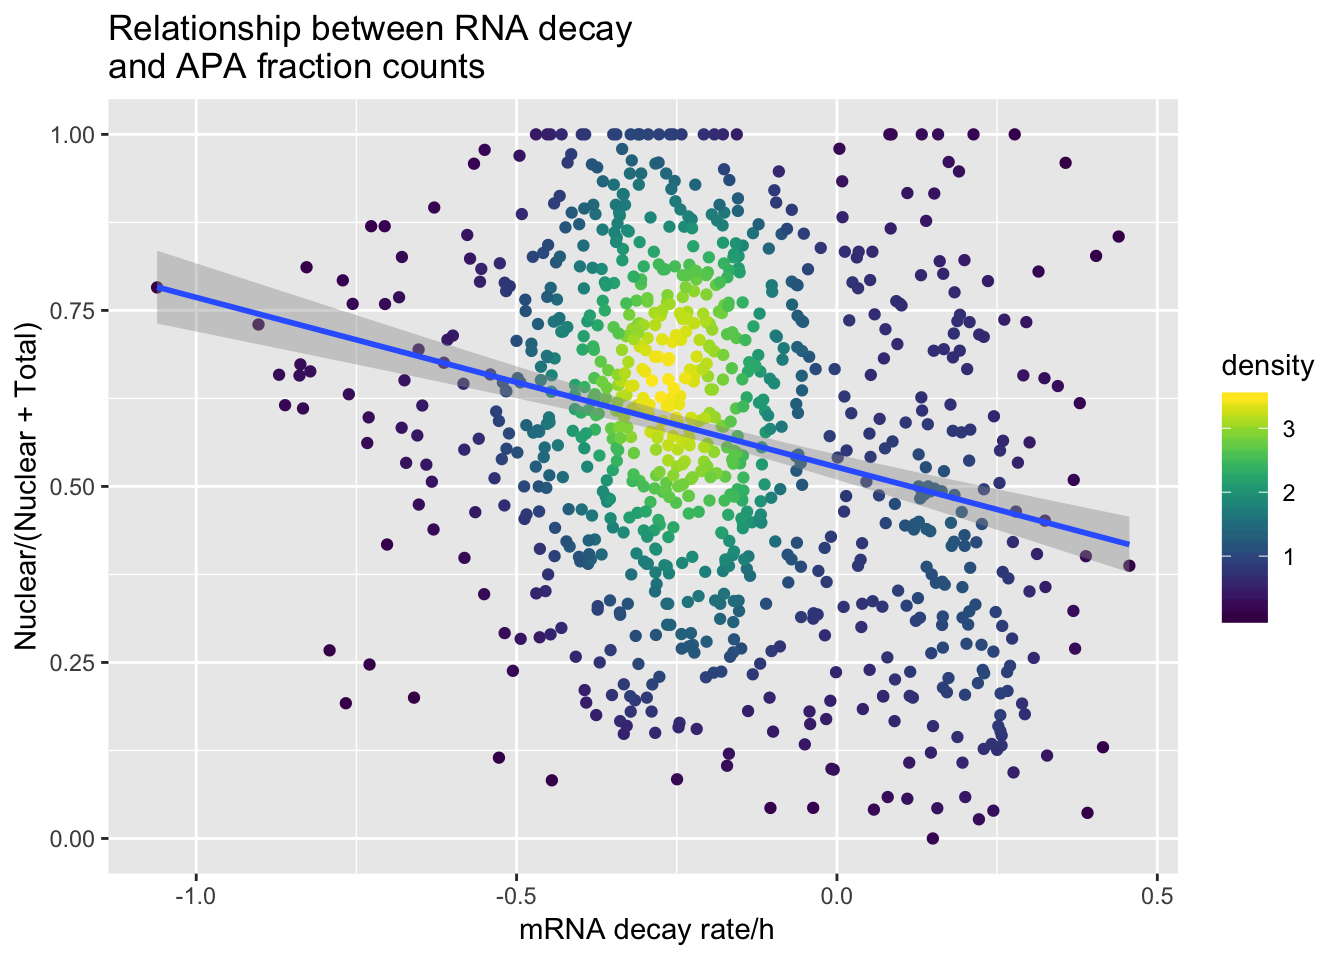
ggsave(APAdecay1sqd_18498, file="../output/plots/APAandRNADecay1SD_18498.png")Saving 7 x 5 in imageUpdate plots, 1 per gene, standardize
I need to full join the mapped read sizes to the APA data.
ApaBothFrac=TotAPA_bygene %>% inner_join(NucAPA_bygene, by=c("GeneName", "Individual"))

ApaBothFrac_melt=melt(ApaBothFrac, id.vars=c("GeneName", "Individual"),value.name="APA_val" ) %>% mutate(fraction=ifelse(variable=="TotalSum", "total", "nuclear"), line=substring(Individual, 2)) %>% dplyr::select(GeneName, fraction, line, APA_val)
I need the mapped read stats:
metadata=read.table("../data/threePrimeSeqMetaData55Ind_noDup_WASPMAP.txt", header = T,stringsAsFactors = F) %>% dplyr::select(line, fraction, Mapped_noMP)

metadata$line= as.character(metadata$line)
Join these:
ApaBothFracStand=ApaBothFrac_melt %>% full_join(metadata, by=c("line", "fraction")) %>% mutate(StandApa=APA_val/Mapped_noMP)Group by the fraction, gene and get the mean of the standard. I can then divide the nuclear mean by the total mean for each gene
ApaBothFracStand_geneMean=ApaBothFracStand %>% group_by(fraction, GeneName) %>% summarise(meanAPA=mean(StandApa, na.rm=T))I want to spread this by fraction.
ApaBothFracStand_geneMean_spread= spread(ApaBothFracStand_geneMean,fraction,meanAPA ) %>% mutate(APAVal=nuclear/(total+ nuclear)) Join with decay
decay_byGene= decay_geneNames_long %>% group_by(GeneName) %>% summarise(MeanDecay=mean(RNA_Decay))


decay_byGene_1d= decay_byGene %>% mutate(Mean=mean(MeanDecay), SD=sd(MeanDecay), Zscore=(MeanDecay-Mean)/SD) %>% filter(abs(Zscore)>1) %>% dplyr::select(GeneName,MeanDecay)
ApaAndDecaySt= ApaBothFracStand_geneMean_spread %>% inner_join(decay_byGene_1d, by="GeneName")
ApaAndDecaySt$density <- get_density(ApaAndDecaySt$APAVal, ApaAndDecaySt$MeanDecay, n = 100)apaanddecay1sd=ggplot(ApaAndDecaySt, aes(x=MeanDecay, y=APAVal)) + geom_point(aes(color=density)) + geom_smooth(method="lm") + labs(x="relative Decay", y="Nuclear/(Total+Nuclear)", title="Relationship between Nuclear proportion and RNA decay\n for decay gene 1SD outside mean")+ scale_color_viridis()
apaanddecay1sd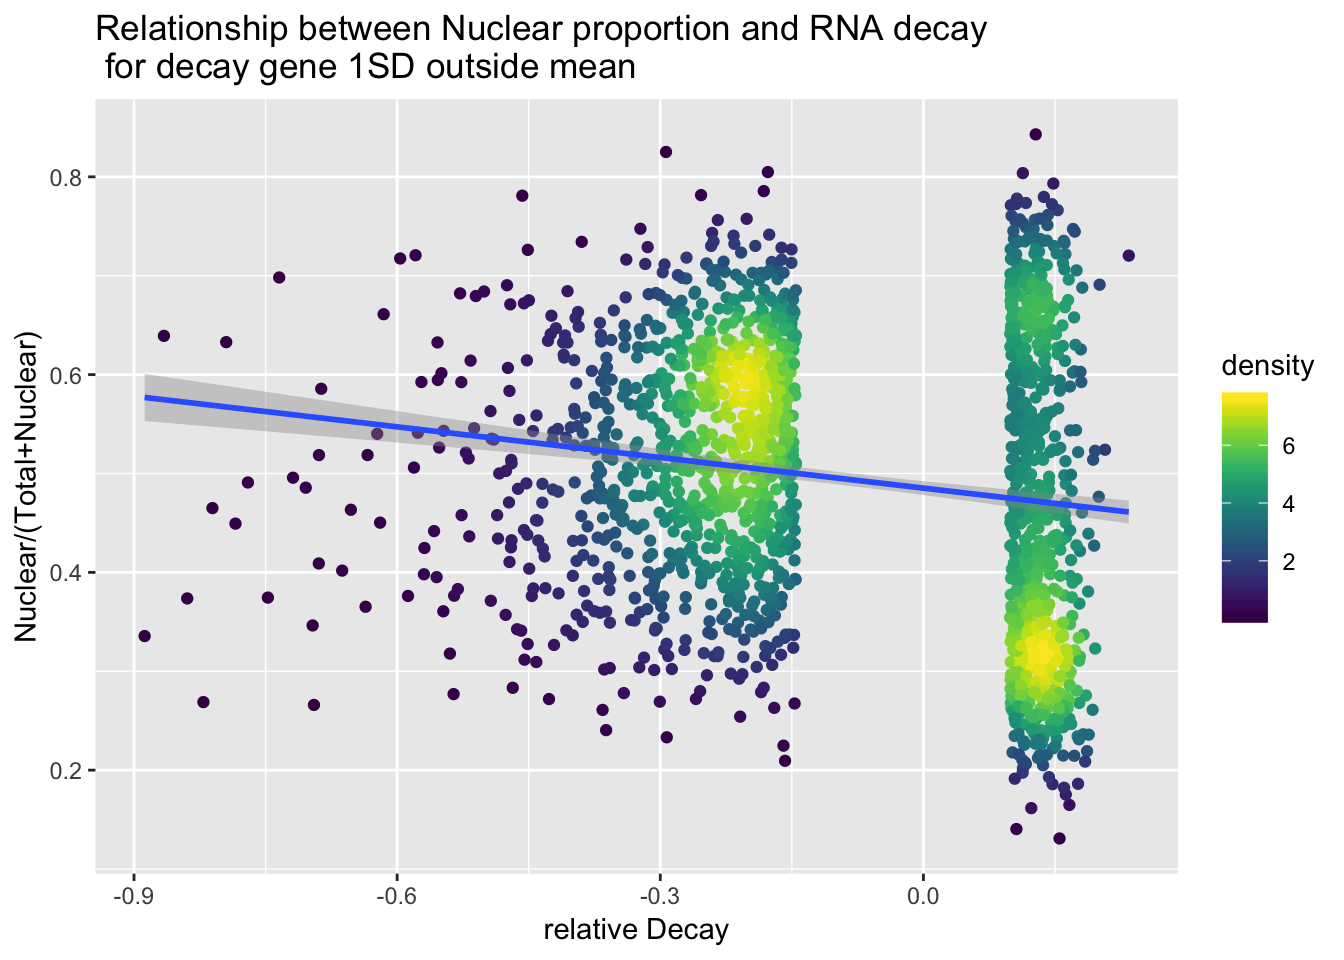
ggsave(apaanddecay1sd, file="../output/plots/ApaRationVDecy1SD.png")Saving 7 x 5 in imagesummary(lm(data=ApaAndDecaySt, APAVal~MeanDecay))
Call:
lm(formula = APAVal ~ MeanDecay, data = ApaAndDecaySt)

Residuals:
    Min      1Q  Median      3Q     Max
-0.3383 -0.1112 -0.0005  0.1085  0.3710

Coefficients:
            Estimate Std. Error t value Pr(>|t|)
(Intercept)  0.48523    0.00359 135.158  < 2e-16 ***
MeanDecay   -0.10327    0.01489  -6.936 5.62e-12 ***
---
Signif. codes:  0 '***' 0.001 '**' 0.01 '*' 0.05 '.' 0.1 ' ' 1

Residual standard error: 0.138 on 1788 degrees of freedom
Multiple R-squared:  0.0262,    Adjusted R-squared:  0.02566
F-statistic: 48.11 on 1 and 1788 DF,  p-value: 5.621e-12
Try all of the value:
ApaAndDecayStall= ApaBothFracStand_geneMean_spread %>% inner_join(decay_byGene, by="GeneName")


ApaAndDecayStall$density <- get_density(ApaAndDecayStall$APAVal, ApaAndDecayStall$MeanDecay, n = 100)

apaanddecayallplot=ggplot(ApaAndDecayStall, aes(x=MeanDecay, y=APAVal)) + geom_point(aes(color=density)) + geom_smooth(method="lm") +labs(x="relative Decay", y="Nuclear/(Total+Nuclear)", title="Relationship between Nuclear proportion and RNA decay")+ scale_color_viridis()

apaanddecayallplot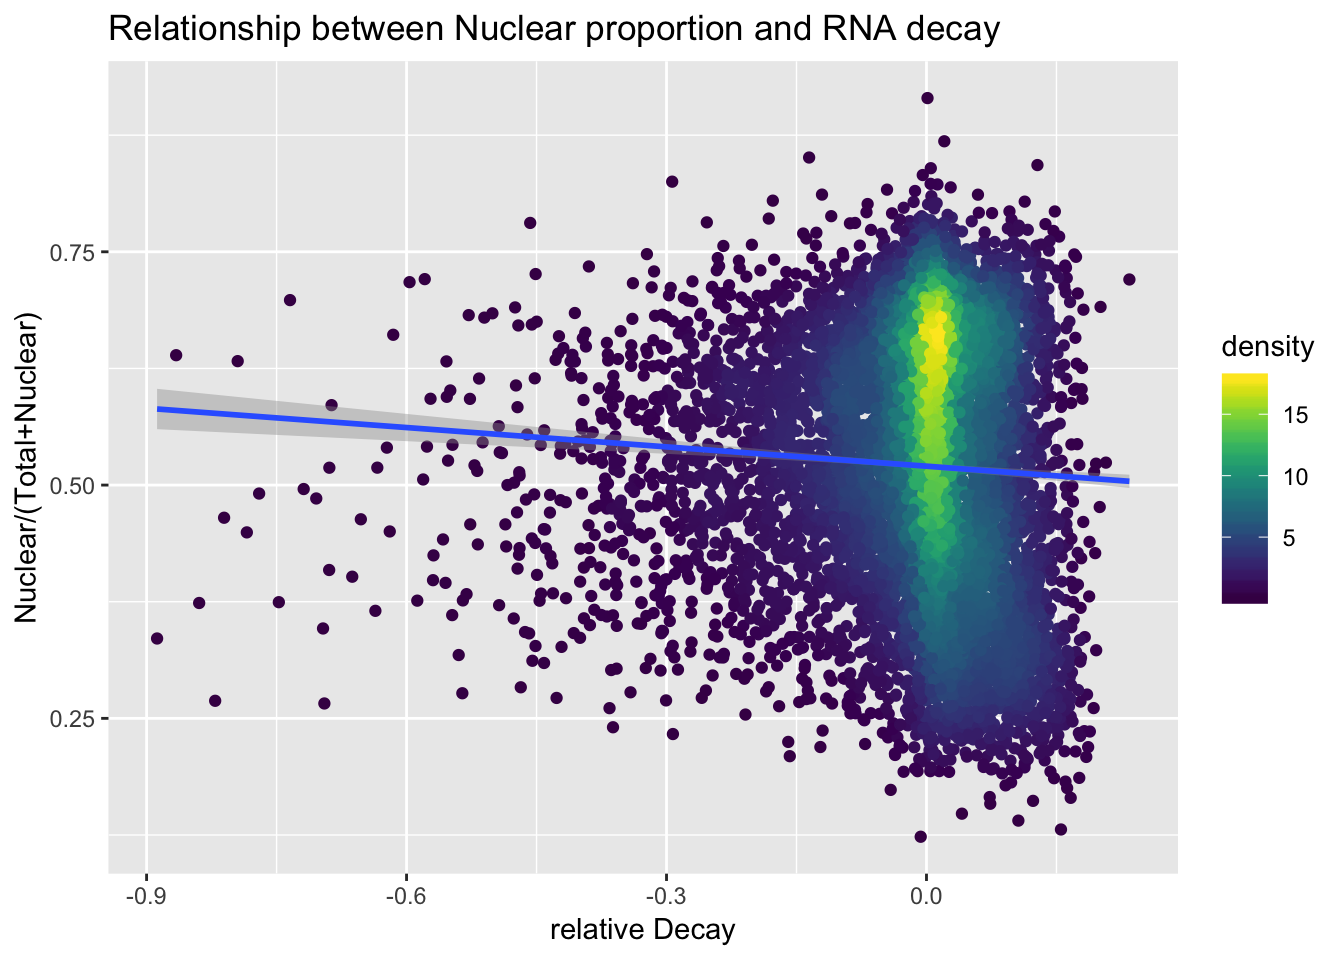
ggsave(apaanddecayallplot, file="../output/plots/ApaRationVDecyAllGenes.png")Saving 7 x 5 in imagesummary(lm(data=ApaAndDecayStall, APAVal~MeanDecay))
Call:
lm(formula = APAVal ~ MeanDecay, data = ApaAndDecayStall)

Residuals:
     Min       1Q   Median       3Q      Max
-0.39756 -0.10362  0.01145  0.11371  0.39458

Coefficients:
             Estimate Std. Error t value Pr(>|t|)
(Intercept)  0.520235   0.001582 328.887  < 2e-16 ***
MeanDecay   -0.069035   0.012646  -5.459 4.93e-08 ***
---
Signif. codes:  0 '***' 0.001 '**' 0.01 '*' 0.05 '.' 0.1 ' ' 1

Residual standard error: 0.1379 on 7886 degrees of freedom
Multiple R-squared:  0.003765,  Adjusted R-squared:  0.003639
F-statistic:  29.8 on 1 and 7886 DF,  p-value: 4.928e-08
Make the same plot with transcription on the X (4su/4su+RNA)
4su data
FourSU=read.table(file = "../data/RNAdecay/tr_decay_table_norm.txt", header=T, stringsAsFactors = F) %>%  dplyr::select(gene_id,contains("4su_30"))


FourSU_geneNames=FourSU %>% inner_join(geneNames, by="gene_id") %>% dplyr::select(GeneName, contains("4su_30"))

FourgeneNames_long=melt(FourSU_geneNames,id.vars = "GeneName", value.name = "FourSU", variable.name = "FourSU_ind") %>% separate(FourSU_ind, into=c("type","time", "1400", "MAf", "Individual"), sep="_") %>% dplyr::select(GeneName, Individual, FourSU)

FourSU_geneMean=FourgeneNames_long %>% group_by(GeneName) %>%summarise(Mean_4su=mean(FourSU))
Gene expression data:
RNA=read.table(file = "../data/RNAdecay/tr_decay_table_norm.txt", header=T, stringsAsFactors = F) %>%  dplyr::select(gene_id,contains("RNAseq_14000"))


RNA_geneNames=RNA %>% inner_join(geneNames, by="gene_id") %>% dplyr::select(GeneName, contains("RNA"))

RNAgeneNames_long=melt(RNA_geneNames,id.vars = "GeneName", value.name = "RNA", variable.name = "RNA_ind") %>%   separate(RNA_ind, into=c("type", "1400", "MAf", "Individual"), sep="_") %>% dplyr::select(GeneName, Individual, RNA)

RNA_geneMean=RNAgeneNames_long %>% group_by(GeneName) %>%summarise(Mean_RNA=mean(RNA))
Join these and make the transcription phenotype
Transcription=FourSU_geneMean %>% inner_join(RNA_geneMean, by="GeneName") %>% mutate(Transcription=Mean_4su/(Mean_4su + Mean_RNA)) %>% dplyr::select(GeneName, Transcription)Join with APA:
APAandTranscrption= Transcription %>% inner_join(ApaBothFracStand_geneMean_spread, by="GeneName")
APAandTranscrption$density <- get_density(APAandTranscrption$APAVal, APAandTranscrption$Transcription, n = 100)

apaand4uplot=ggplot(APAandTranscrption, aes(x=Transcription, y=APAVal))+ geom_point(aes(color=density)) + geom_smooth(method = "lm") + labs(x="4su/4su+RNA", y="Nuclear/Nuclear+Total", title="Relationship between APA fraction and transcription") + scale_color_viridis()


summary(lm(data=APAandTranscrption, APAVal~Transcription))
Call:
lm(formula = APAVal ~ Transcription, data = APAandTranscrption)

Residuals:
     Min       1Q   Median       3Q      Max
-0.45569 -0.09980  0.00815  0.10627  0.38149

Coefficients:
              Estimate Std. Error t value Pr(>|t|)
(Intercept)   0.354663   0.007229   49.06   <2e-16 ***
Transcription 0.319004   0.013488   23.65   <2e-16 ***
---
Signif. codes:  0 '***' 0.001 '**' 0.01 '*' 0.05 '.' 0.1 ' ' 1

Residual standard error: 0.1335 on 7886 degrees of freedom
Multiple R-squared:  0.06623,   Adjusted R-squared:  0.06612
F-statistic: 559.4 on 1 and 7886 DF,  p-value: < 2.2e-16
apaand4uplot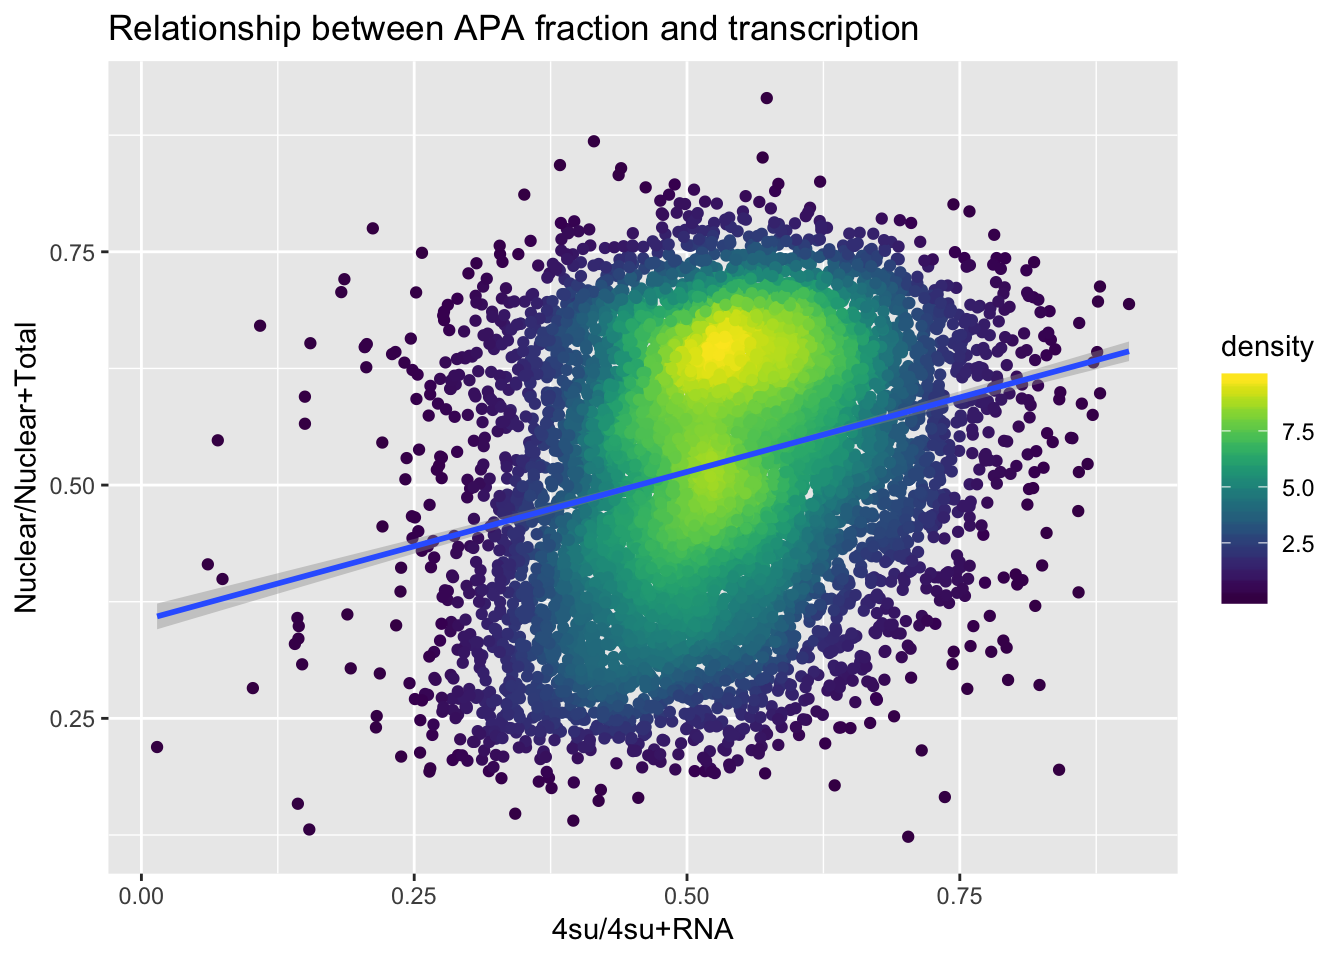
ggsave(apaand4uplot, file="../output/plots/NuclearTotalRatiov4suRNARatio.png")Saving 7 x 5 in image
sessionInfo()R version 3.5.1 (2018-07-02)
Platform: x86_64-apple-darwin15.6.0 (64-bit)
Running under: macOS 10.14.1
Matrix products: default
BLAS: /Library/Frameworks/R.framework/Versions/3.5/Resources/lib/libRblas.0.dylib
LAPACK: /Library/Frameworks/R.framework/Versions/3.5/Resources/lib/libRlapack.dylib
locale:
[1] en_US.UTF-8/en_US.UTF-8/en_US.UTF-8/C/en_US.UTF-8/en_US.UTF-8
attached base packages:
[1] stats graphics grDevices utils datasets methods base
other attached packages:
[1] viridis_0.5.1 viridisLite_0.3.0 MASS_7.3-51.1
[4] reshape2_1.4.3 forcats_0.4.0 stringr_1.4.0
[7] dplyr_0.8.0.1 purrr_0.3.1 readr_1.3.1
[10] tidyr_0.8.3 tibble_2.0.1 ggplot2_3.1.0
[13] tidyverse_1.2.1
loaded via a namespace (and not attached):
[1] tidyselect_0.2.5 xfun_0.5 haven_2.1.0 lattice_0.20-38
[5] colorspace_1.4-0 generics_0.0.2 htmltools_0.3.6 yaml_2.2.0
[9] rlang_0.3.1 pillar_1.3.1 glue_1.3.0 withr_2.1.2
[13] modelr_0.1.4 readxl_1.3.0 plyr_1.8.4 munsell_0.5.0
[17] gtable_0.2.0 workflowr_1.2.0 cellranger_1.1.0 rvest_0.3.2
[21] evaluate_0.13 labeling_0.3 knitr_1.21 broom_0.5.1
[25] Rcpp_1.0.0 scales_1.0.0 backports_1.1.3 jsonlite_1.6
[29] fs_1.2.6 gridExtra_2.3 hms_0.4.2 digest_0.6.18
[33] stringi_1.3.1 grid_3.5.1 rprojroot_1.3-2 cli_1.0.1
[37] tools_3.5.1 magrittr_1.5 lazyeval_0.2.1 crayon_1.3.4
[41] whisker_0.3-2 pkgconfig_2.0.2 xml2_1.2.0 lubridate_1.7.4
[45] assertthat_0.2.0 rmarkdown_1.11 httr_1.4.0 rstudioapi_0.9.0
[49] R6_2.4.0 nlme_3.1-137 git2r_0.24.0 compiler_3.5.1