DiffIsoAnalaysis New mapping
Briana Mittleman
2/18/2019
Last updated: 2019-02-28
Checks: 6 0
Knit directory: threeprimeseq/analysis/
This reproducible R Markdown analysis was created with workflowr (version 1.2.0). The Report tab describes the reproducibility checks that were applied when the results were created. The Past versions tab lists the development history.
Great! Since the R Markdown file has been committed to the Git repository, you know the exact version of the code that produced these results.
Great job! The global environment was empty. Objects defined in the global environment can affect the analysis in your R Markdown file in unknown ways. For reproduciblity it’s best to always run the code in an empty environment.
The command set.seed(12345) was run prior to running the code in the R Markdown file. Setting a seed ensures that any results that rely on randomness, e.g. subsampling or permutations, are reproducible.
Great job! Recording the operating system, R version, and package versions is critical for reproducibility.
Nice! There were no cached chunks for this analysis, so you can be confident that you successfully produced the results during this run.
Great! You are using Git for version control. Tracking code development and connecting the code version to the results is critical for reproducibility. The version displayed above was the version of the Git repository at the time these results were generated.
Note that you need to be careful to ensure that all relevant files for the analysis have been committed to Git prior to generating the results (you can use wflow_publish or wflow_git_commit). workflowr only checks the R Markdown file, but you know if there are other scripts or data files that it depends on. Below is the status of the Git repository when the results were generated:
Ignored files:
    Ignored:    .DS_Store
    Ignored:    .Rhistory
    Ignored:    .Rproj.user/
    Ignored:    data/.DS_Store
    Ignored:    data/perm_QTL_trans_noMP_5percov/
    Ignored:    output/.DS_Store

Untracked files:
    Untracked:  KalistoAbundance18486.txt
    Untracked:  analysis/4suDataIGV.Rmd
    Untracked:  analysis/DirectionapaQTL.Rmd
    Untracked:  analysis/EvaleQTLs.Rmd
    Untracked:  analysis/YL_QTL_test.Rmd
    Untracked:  analysis/groSeqAnalysis.Rmd
    Untracked:  analysis/ncbiRefSeq_sm.sort.mRNA.bed
    Untracked:  analysis/snake.config.notes.Rmd
    Untracked:  analysis/verifyBAM.Rmd
    Untracked:  analysis/verifybam_dubs.Rmd
    Untracked:  code/PeaksToCoverPerReads.py
    Untracked:  code/strober_pc_pve_heatmap_func.R
    Untracked:  data/18486.genecov.txt
    Untracked:  data/APApeaksYL.total.inbrain.bed
    Untracked:  data/AllPeak_counts/
    Untracked:  data/ApaQTLs/
    Untracked:  data/ApaQTLs_otherPhen/
    Untracked:  data/ChromHmmOverlap/
    Untracked:  data/DistTXN2Peak_genelocAnno/
    Untracked:  data/GM12878.chromHMM.bed
    Untracked:  data/GM12878.chromHMM.txt
    Untracked:  data/LianoglouLCL/
    Untracked:  data/LocusZoom/
    Untracked:  data/LocusZoom_Unexp/
    Untracked:  data/LocusZoom_proc/
    Untracked:  data/MatchedSnps/
    Untracked:  data/NuclearApaQTLs.txt
    Untracked:  data/PeakCounts/
    Untracked:  data/PeakCounts_noMP_5perc/
    Untracked:  data/PeakCounts_noMP_genelocanno/
    Untracked:  data/PeakUsage/
    Untracked:  data/PeakUsage_noMP/
    Untracked:  data/PeakUsage_noMP_GeneLocAnno/
    Untracked:  data/PeaksUsed/
    Untracked:  data/PeaksUsed_noMP_5percCov/
    Untracked:  data/QTL_overlap/
    Untracked:  data/RNAkalisto/
    Untracked:  data/RefSeq_annotations/
    Untracked:  data/Replicates_usage/
    Untracked:  data/TotalApaQTLs.txt
    Untracked:  data/Totalpeaks_filtered_clean.bed
    Untracked:  data/UnderstandPeaksQC/
    Untracked:  data/WASP_STAT/
    Untracked:  data/YL-SP-18486-T-combined-genecov.txt
    Untracked:  data/YL-SP-18486-T_S9_R1_001-genecov.txt
    Untracked:  data/YL_QTL_test/
    Untracked:  data/apaExamp/
    Untracked:  data/apaExamp_proc/
    Untracked:  data/apaQTL_examp_noMP/
    Untracked:  data/bedgraph_peaks/
    Untracked:  data/bin200.5.T.nuccov.bed
    Untracked:  data/bin200.Anuccov.bed
    Untracked:  data/bin200.nuccov.bed
    Untracked:  data/clean_peaks/
    Untracked:  data/comb_map_stats.csv
    Untracked:  data/comb_map_stats.xlsx
    Untracked:  data/comb_map_stats_39ind.csv
    Untracked:  data/combined_reads_mapped_three_prime_seq.csv
    Untracked:  data/diff_iso_GeneLocAnno/
    Untracked:  data/diff_iso_proc/
    Untracked:  data/diff_iso_trans/
    Untracked:  data/eQTLs_Lietal/
    Untracked:  data/ensemble_to_genename.txt
    Untracked:  data/example_gene_peakQuant/
    Untracked:  data/explainProtVar/
    Untracked:  data/filtPeakOppstrand_cov_noMP_GeneLocAnno_5perc/
    Untracked:  data/filtered_APApeaks_merged_allchrom_refseqTrans.closest2End.bed
    Untracked:  data/filtered_APApeaks_merged_allchrom_refseqTrans.closest2End.noties.bed
    Untracked:  data/first50lines_closest.txt
    Untracked:  data/gencov.test.csv
    Untracked:  data/gencov.test.txt
    Untracked:  data/gencov_zero.test.csv
    Untracked:  data/gencov_zero.test.txt
    Untracked:  data/gene_cov/
    Untracked:  data/joined
    Untracked:  data/leafcutter/
    Untracked:  data/merged_combined_YL-SP-threeprimeseq.bg
    Untracked:  data/molPheno_noMP/
    Untracked:  data/mol_overlap/
    Untracked:  data/mol_pheno/
    Untracked:  data/nom_QTL/
    Untracked:  data/nom_QTL_opp/
    Untracked:  data/nom_QTL_trans/
    Untracked:  data/nuc6up/
    Untracked:  data/nuc_10up/
    Untracked:  data/other_qtls/
    Untracked:  data/pQTL_otherphen/
    Untracked:  data/pacbio_cov/
    Untracked:  data/peakPerRefSeqGene/
    Untracked:  data/peaks4DT/
    Untracked:  data/perm_QTL/
    Untracked:  data/perm_QTL_GeneLocAnno_noMP_5percov/
    Untracked:  data/perm_QTL_GeneLocAnno_noMP_5percov_3UTR/
    Untracked:  data/perm_QTL_diffWindow/
    Untracked:  data/perm_QTL_opp/
    Untracked:  data/perm_QTL_trans/
    Untracked:  data/perm_QTL_trans_filt/
    Untracked:  data/protAndAPAAndExplmRes.Rda
    Untracked:  data/protAndAPAlmRes.Rda
    Untracked:  data/protAndExpressionlmRes.Rda
    Untracked:  data/reads_mapped_three_prime_seq.csv
    Untracked:  data/smash.cov.results.bed
    Untracked:  data/smash.cov.results.csv
    Untracked:  data/smash.cov.results.txt
    Untracked:  data/smash_testregion/
    Untracked:  data/ssFC200.cov.bed
    Untracked:  data/temp.file1
    Untracked:  data/temp.file2
    Untracked:  data/temp.gencov.test.txt
    Untracked:  data/temp.gencov_zero.test.txt
    Untracked:  data/threePrimeSeqMetaData.csv
    Untracked:  data/threePrimeSeqMetaData55Ind.txt
    Untracked:  data/threePrimeSeqMetaData55Ind.xlsx
    Untracked:  data/threePrimeSeqMetaData55Ind_noDup.txt
    Untracked:  data/threePrimeSeqMetaData55Ind_noDup.xlsx
    Untracked:  data/threePrimeSeqMetaData55Ind_noDup_WASPMAP.txt
    Untracked:  data/threePrimeSeqMetaData55Ind_noDup_WASPMAP.xlsx
    Untracked:  output/LZ/
    Untracked:  output/deeptools_plots/
    Untracked:  output/picard/
    Untracked:  output/plots/
    Untracked:  output/qual.fig2.pdf

Unstaged changes:
    Modified:   analysis/28ind.peak.explore.Rmd
    Modified:   analysis/CompareLianoglouData.Rmd
    Modified:   analysis/NewPeakPostMP.Rmd
    Modified:   analysis/apaQTLoverlapGWAS.Rmd
    Modified:   analysis/cleanupdtseq.internalpriming.Rmd
    Modified:   analysis/coloc_apaQTLs_protQTLs.Rmd
    Modified:   analysis/dif.iso.usage.leafcutter.Rmd
    Modified:   analysis/diff_iso_pipeline.Rmd
    Modified:   analysis/explainpQTLs.Rmd
    Modified:   analysis/explore.filters.Rmd
    Modified:   analysis/flash2mash.Rmd
    Modified:   analysis/mispriming_approach.Rmd
    Modified:   analysis/overlapMolQTL.Rmd
    Modified:   analysis/overlapMolQTL.opposite.Rmd
    Modified:   analysis/overlap_qtls.Rmd
    Modified:   analysis/peakOverlap_oppstrand.Rmd
    Modified:   analysis/peakQCPPlots.Rmd
    Modified:   analysis/peakQCplotsSTARprocessing.Rmd
    Modified:   analysis/pheno.leaf.comb.Rmd
    Modified:   analysis/pipeline_55Ind.Rmd
    Modified:   analysis/swarmPlots_QTLs.Rmd
    Modified:   analysis/test.max2.Rmd
    Modified:   analysis/test.smash.Rmd
    Modified:   analysis/understandPeaks.Rmd
    Modified:   analysis/unexplainedeQTL_analysis.Rmd
    Modified:   code/Snakefile
Note that any generated files, e.g. HTML, png, CSS, etc., are not included in this status report because it is ok for generated content to have uncommitted changes.
These are the previous versions of the R Markdown and HTML files. If you’ve configured a remote Git repository (see ?wflow_git_remote), click on the hyperlinks in the table below to view them.
| File | Version | Author | Date | Message |
|---|---|---|---|---|
| Rmd | 37b0459 | Briana Mittleman | 2019-02-28 | write out nuc spec |
| html | 618ef43 | Briana Mittleman | 2019-02-27 | Build site. |
| Rmd | c583588 | Briana Mittleman | 2019-02-27 | add res and plots |
| html | dd8d988 | Briana Mittleman | 2019-02-21 | Build site. |
| Rmd | d210987 | Briana Mittleman | 2019-02-21 | add res and plots |
| html | 4ea438e | Briana Mittleman | 2019-02-18 | Build site. |
| Rmd | bcb2f86 | Briana Mittleman | 2019-02-18 | add qtl by per and diff iso |
library(tidyverse)── Attaching packages ──────────────────────────────────────────────────────────────────────────── tidyverse 1.2.1 ──✔ ggplot2 3.0.0 ✔ purrr 0.2.5
✔ tibble 1.4.2 ✔ dplyr 0.7.6
✔ tidyr 0.8.1 ✔ stringr 1.4.0
✔ readr 1.1.1 ✔ forcats 0.3.0Warning: package 'stringr' was built under R version 3.5.2── Conflicts ─────────────────────────────────────────────────────────────────────────────── tidyverse_conflicts() ──
✖ dplyr::filter() masks stats::filter()
✖ dplyr::lag() masks stats::lag()library(workflowr)This is workflowr version 1.2.0
Run ?workflowr for help getting startedlibrary(reshape2)
Attaching package: 'reshape2'The following object is masked from 'package:tidyr':
smiths- filternamePeaks5percCov_GeneLocAnno.py
- bothFrac_processed_GeneLocAnno_FC.sh
- fix_head_fc_procBothFrac_GeneLocAnno.py
- fc2leafphen_processed_GeneLocAnno.py
- subset_diffisopheno_processed_GeneLocAnno.py/ run_subset_diffisopheno_processed_GeneLocAnno.sh
- makeLCSampleList_processed_GeneLocAnno.py
- run_leafcutter_ds_bychrom_processed_GeneLocAnno.sh
Leafcutter environment: module unload Anaconda3 module load Anaconda3/5.3.0 conda activate leafcutter
awk '{if(NR>1)print}' /project2/gilad/briana/threeprimeseq/data/diff_iso_processed_GeneLocAnno/TN_diff_isoform_GeneLocAnno_chr*.txt_effect_sizes.txt > /project2/gilad/briana/threeprimeseq/data/diff_iso_processed_GeneLocAnno/TN_diff_isoform_GeneLocAnno_AllChrom.txt_effect_sizes.txt

awk '{if(NR>1)print}' /project2/gilad/briana/threeprimeseq/data/diff_iso_processed_GeneLocAnno/TN_diff_isoform_GeneLocAnno_chr*cluster_significance.txt > /project2/gilad/briana/threeprimeseq/data/diff_iso_processed_GeneLocAnno/TN_diff_isoform_GeneLocAnno_AllChrom.txt_cluster_significance.txt
diffIso=read.table("../data/diff_iso_GeneLocAnno/TN_diff_isoform_GeneLocAnno_AllChrom.txt_cluster_significance.txt", header = F,col.names = c("status", "loglr", "df", "p", "cluster", "p.adjust"),stringsAsFactors = F,sep="\t") %>% filter(status == "Success")
diffIso$p.adjust=as.numeric(as.character(diffIso$p.adjust))Make plot
png("../output/plots/DiffIsoQQplot.png")
qqplot(-log10(runif(nrow(diffIso))), -log10(diffIso$p.adjust),ylab="-log10 Total Adjusted Leafcutter pvalue", xlab="-log 10 Uniform expectation", main="Leafcutter differencial isoform analysis between fractions")
abline(0,1)
dev.off()
quartz_off_screen
2 diffIso_10FDR=diffIso %>% filter(-log10(p.adjust)>1)
diffIso_10FDR_genes=diffIso_10FDR %>% separate(cluster, into = c("chr", "gene"), sep=":") %>% group_by(gene) %>% tally()
nrow(diffIso_10FDR_genes)[1] 8227There are 8227 significant genes
effectsize=read.table("../data/diff_iso_GeneLocAnno/TN_diff_isoform_GeneLocAnno_AllChrom.txt_effect_sizes.txt", stringsAsFactors = F, col.names=c('intron',  'logef' ,'Nuclear', 'Total','deltapsi'))

effectsize$deltapsi=as.numeric(as.character(effectsize$deltapsi))
Warning: NAs introduced by coercioneffectsize$logef=as.numeric(as.character(effectsize$logef))Warning: NAs introduced by coercionplot(sort(effectsize$deltapsi),main="Leafcutter delta PSI", ylab="Delta PSI", xlab="Peak Index")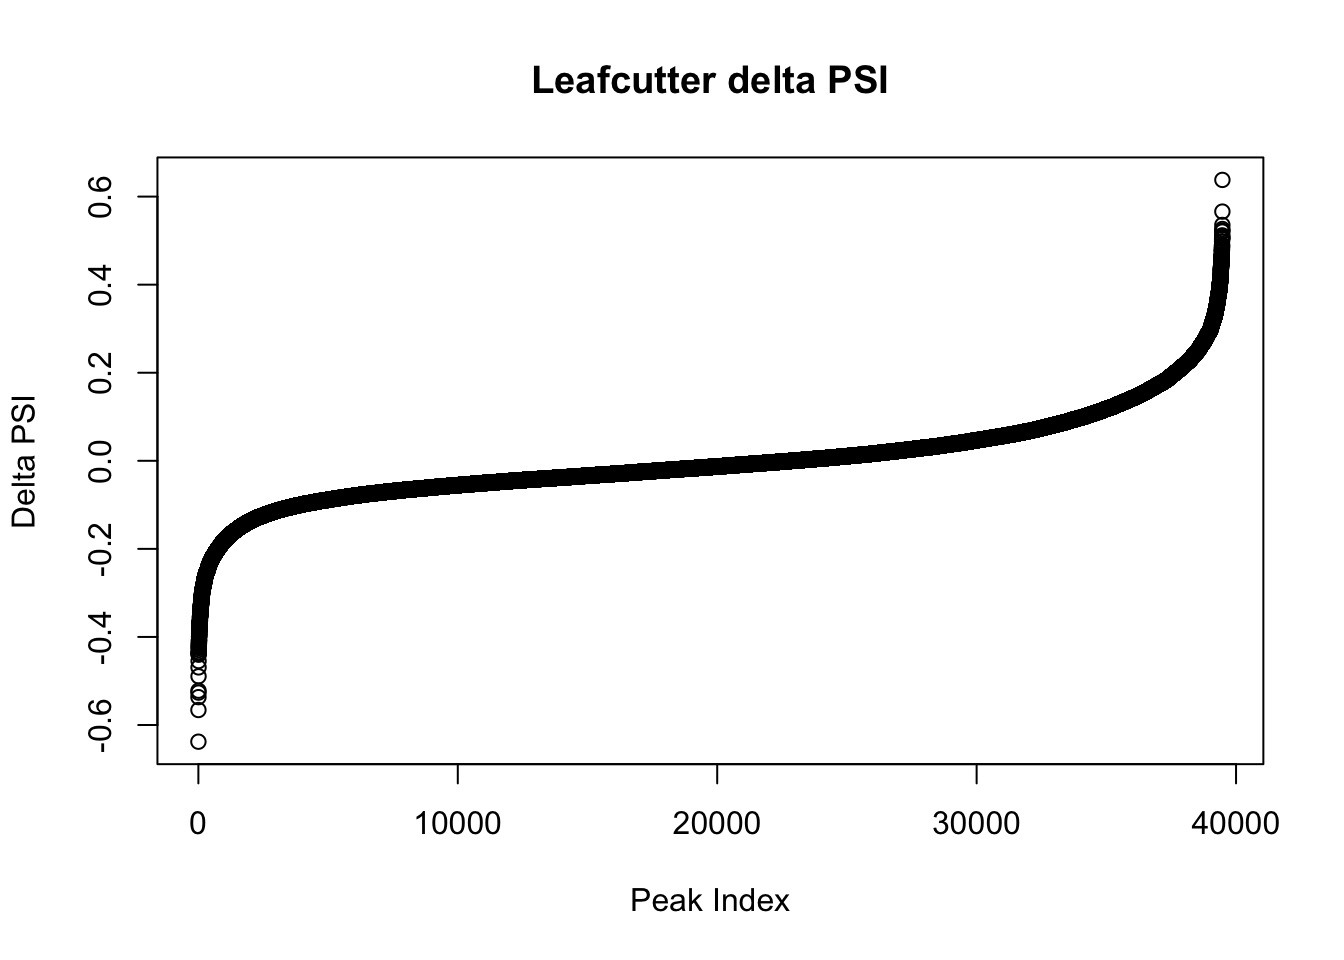
| Version | Author | Date |
|---|---|---|
| dd8d988 | Briana Mittleman | 2019-02-21 |
effectsize_dpsi= effectsize %>% filter(abs(deltapsi) > .2)

effectsize_dpsi_gene= effectsize %>% filter(abs(deltapsi) > .2) %>% separate(intron, into=c("chr", 'start', 'end','gene'), sep=":") %>% group_by(gene) %>% tally()

nrow(effectsize_dpsi)
[1] 2574nrow(effectsize_dpsi_gene)[1] 1983inboth=effectsize_dpsi_gene %>% inner_join(diffIso_10FDR_genes, by="gene")
nrow(inboth)[1] 1983There are 1983 genes that are significant at 10 FDR with peaks with delta psi > .2. There are 2574 peaks in this set.
arrange(effectsize_dpsi,deltapsi) %>% head() intron logef Nuclear
1 chr1:151134497:151134579:TNFAIP8L2 -1.531127 0.78054161651153
2 chr21:43762910:43762982:TFF2 -1.292723 0.7517177403328
3 chr3:23306502:23306675:UBE2E2 -1.576854 0.689518624324535
4 chr14:67029307:67029417:GPHN -1.178720 0.79525048466399
5 chr6:84007319:84007404:ME1 -1.941535 0.637895884685942
6 chr7:73885912:73885994:GTF2IRD1 -1.094156 0.803004504625396
Total deltapsi
1 0.142652878646319 -0.6378887
2 0.185782405086405 -0.5659353
3 0.152772791233433 -0.5367458
4 0.268829380937913 -0.5264211
5 0.115849020504727 -0.5220469
6 0.313645034829832 -0.4893595How many total genes tested:
diffIsoGene=diffIso %>% separate(cluster, into=c("chrom", "gene"), sep = ":")

length(unique(diffIsoGene$gene))
[1] 9790We tested 9790 genes and 8227 are significant at FDR 10%
I can make a plot that separates genes into tested, if passes has fdr 10%, if it has a peak greater than .2 delta psi.
sigandPSIGene=effectsize_dpsi_gene$gene
SiggenesDF=diffIso_10FDR %>% separate(cluster, into=c("chrom", "gene"), sep = ":")  %>% select(gene)
Siggenes = SiggenesDF$gene
LCgeneDF=diffIsoGene %>% select(gene)
LCgene=LCgeneDF$gene
type=c("NotSig", "Sig", "SigHighDPAU")
nGenes=c(1563, 6244,1983)
nGenesProp=c(1563/9790, 6244/9790, 1983/9790)
LCDF=data.frame(cbind(type, nGenes, nGenesProp))
LCDF$nGenesProp=as.numeric(as.character(LCDF$nGenesProp))labT=paste("Genes =", "1563", sep=" ")
labS=paste("Genes =", "6244", sep=" ")
labD=paste("Genes =", "1983", sep=" ")
LCResplot=ggplot(LCDF, aes(x=" ", y=nGenesProp, fill=type))+ geom_bar(stat="identity") + labs(x="Total Genes = 9790", y="Proportion of Genes", title="Proportion of Genes \nby Differencial PAU Test Result") + annotate("text", x=" ", y= .1, label=labT) + annotate("text", x=" ", y= .5, label=labS) + annotate("text", x=" ", y= .9, label=labD) + scale_fill_brewer(palette="RdYlBu")
LCResplot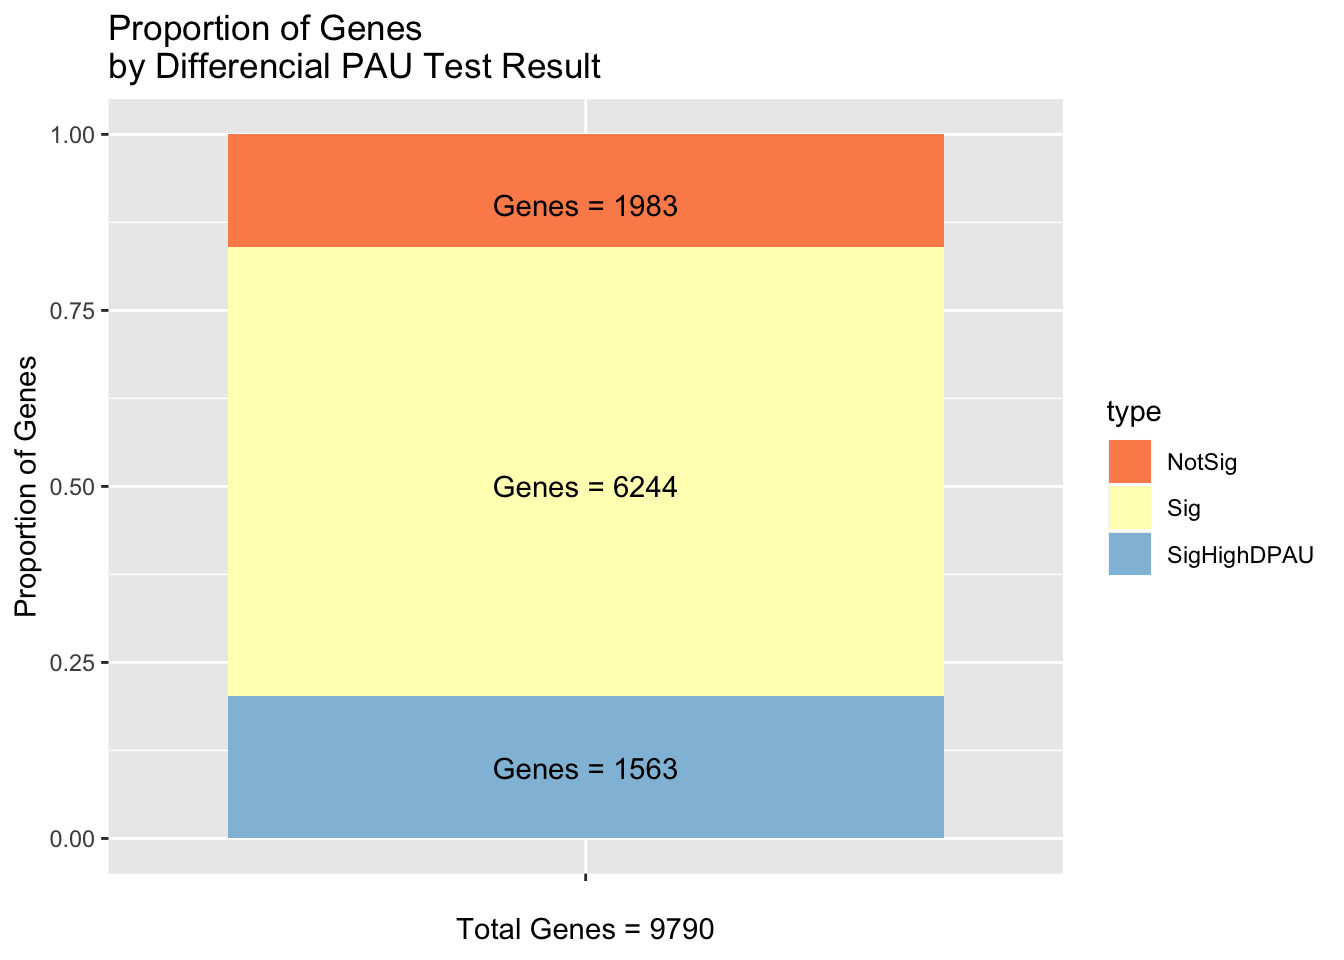
| Version | Author | Date |
|---|---|---|
| dd8d988 | Briana Mittleman | 2019-02-21 |
ggsave(LCResplot, file="../output/plots/LCResPlot.png",height=8, width=5)As a boxplot:
LCResplotpie=ggplot(LCDF, aes(x=" ", y=nGenesProp, fill=type))+ geom_bar(stat="identity") + labs(x="Total Genes = 9790", y="Proportion of Genes", title="Proportion of Genes \nby Differencial PAU Test Result")  + scale_fill_brewer(palette="RdYlBu")+ coord_polar("y")

LCResplotpie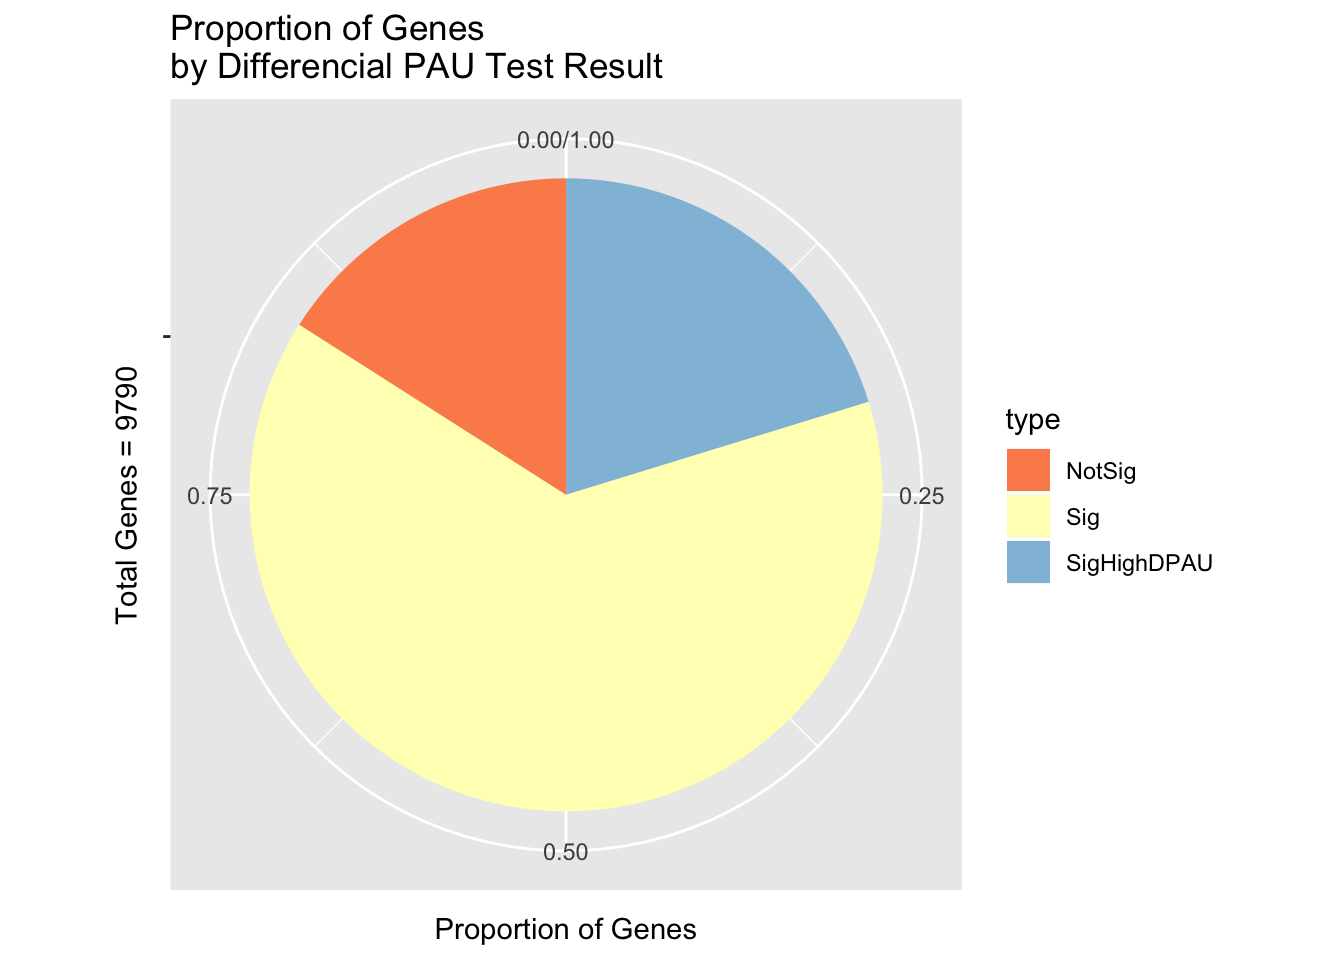
| Version | Author | Date |
|---|---|---|
| dd8d988 | Briana Mittleman | 2019-02-21 |
ggsave(LCResplotpie, file="../output/plots/LCResBoxPie.png")Saving 7 x 5 in imageLook at examples:
arrange(effectsize_dpsi,deltapsi) %>% head(n=15) intron logef Nuclear
1 chr1:151134497:151134579:TNFAIP8L2 -1.5311270 0.78054161651153
2 chr21:43762910:43762982:TFF2 -1.2927231 0.7517177403328
3 chr3:23306502:23306675:UBE2E2 -1.5768538 0.689518624324535
4 chr14:67029307:67029417:GPHN -1.1787199 0.79525048466399
5 chr6:84007319:84007404:ME1 -1.9415348 0.637895884685942
6 chr7:73885912:73885994:GTF2IRD1 -1.0941563 0.803004504625396
7 chr10:76217704:76217788:ADK -2.3345121 0.514019809620595
8 chr13:76202828:76202942:LMO7-AS1 -0.9814079 0.72785023020159
9 chr11:10415338:10415423:CAND1.11 -0.9620970 0.664450041884926
10 chr3:52434425:52434511:DNAH1 -0.9754214 0.643269826767032
11 chr11:61518275:61518363:DKFZP434K028 -0.9377435 0.715454168470806
12 chr1:246336771:246336983:SMYD3 -1.3736073 0.493768702856053
13 chr1:52550381:52550450:BTF3L4 -1.5857042 0.542706568051568
14 chr13:99716094:99716178:DOCK9 -1.9875150 0.479993274419107
15 chr1:234519189:234519278:COA6 -1.4539240 0.535470572408034
Total deltapsi
1 0.142652878646319 -0.6378887
2 0.185782405086405 -0.5659353
3 0.152772791233433 -0.5367458
4 0.268829380937913 -0.5264211
5 0.115849020504727 -0.5220469
6 0.313645034829832 -0.4893595
7 0.0448511480538154 -0.4691687
8 0.273075759544 -0.4547745
9 0.224261076041106 -0.4401890
10 0.204035877067268 -0.4392339
11 0.278188768939522 -0.4372654
12 0.0588483217543034 -0.4349204
13 0.108088063042586 -0.4346185
14 0.0504035538093602 -0.4295897
15 0.110557031548937 -0.4249135Stuck on visualization
peak5329- that is the QTL peak for dock7
test=read.table("../data/PeakUsage_noMP_GeneLocAnno/filtered_APApeaks_merged_allchrom_refseqGenes.GeneLocAnno.NoMP_sm_quant.Total_fixed.pheno.5percPeaks.txt")
testN=read.table("../data/PeakUsage_noMP_GeneLocAnno/filtered_APApeaks_merged_allchrom_refseqGenes.GeneLocAnno.NoMP_sm_quant.Nuclear_fixed.pheno.5percPeaks.txt")
Write out the peaks that are more used in nuclear. These have a negative delta psi
effectsize_dpsi_nuc=effectsize_dpsi %>% filter(deltapsi<0)

write.table(effectsize_dpsi_nuc, file="../data/diff_iso_GeneLocAnno/SigPeaksHigherInNuc.txt", col.names = T, quote = F, row.names = F)
sessionInfo()R version 3.5.1 (2018-07-02)
Platform: x86_64-apple-darwin15.6.0 (64-bit)
Running under: macOS 10.14.1
Matrix products: default
BLAS: /Library/Frameworks/R.framework/Versions/3.5/Resources/lib/libRblas.0.dylib
LAPACK: /Library/Frameworks/R.framework/Versions/3.5/Resources/lib/libRlapack.dylib
locale:
[1] en_US.UTF-8/en_US.UTF-8/en_US.UTF-8/C/en_US.UTF-8/en_US.UTF-8
attached base packages:
[1] stats graphics grDevices utils datasets methods base
other attached packages:
[1] bindrcpp_0.2.2 reshape2_1.4.3 workflowr_1.2.0 forcats_0.3.0
[5] stringr_1.4.0 dplyr_0.7.6 purrr_0.2.5 readr_1.1.1
[9] tidyr_0.8.1 tibble_1.4.2 ggplot2_3.0.0 tidyverse_1.2.1
loaded via a namespace (and not attached):
[1] tidyselect_0.2.4 haven_1.1.2 lattice_0.20-35
[4] colorspace_1.3-2 htmltools_0.3.6 yaml_2.2.0
[7] rlang_0.2.2 pillar_1.3.0 glue_1.3.0
[10] withr_2.1.2 RColorBrewer_1.1-2 modelr_0.1.2
[13] readxl_1.1.0 bindr_0.1.1 plyr_1.8.4
[16] munsell_0.5.0 gtable_0.2.0 cellranger_1.1.0
[19] rvest_0.3.2 evaluate_0.13 labeling_0.3
[22] knitr_1.20 broom_0.5.0 Rcpp_0.12.19
[25] scales_1.0.0 backports_1.1.2 jsonlite_1.6
[28] fs_1.2.6 hms_0.4.2 digest_0.6.17
[31] stringi_1.2.4 grid_3.5.1 rprojroot_1.3-2
[34] cli_1.0.1 tools_3.5.1 magrittr_1.5
[37] lazyeval_0.2.1 crayon_1.3.4 whisker_0.3-2
[40] pkgconfig_2.0.2 xml2_1.2.0 lubridate_1.7.4
[43] assertthat_0.2.0 rmarkdown_1.11 httr_1.3.1
[46] rstudioapi_0.9.0 R6_2.3.0 nlme_3.1-137
[49] git2r_0.24.0 compiler_3.5.1