LocusZoom Plot
Briana Mittleman
11/15/2018
Last updated: 2019-02-15
Checks: 6 0
Knit directory: threeprimeseq/analysis/
This reproducible R Markdown analysis was created with workflowr (version 1.2.0). The Report tab describes the reproducibility checks that were applied when the results were created. The Past versions tab lists the development history.
Great! Since the R Markdown file has been committed to the Git repository, you know the exact version of the code that produced these results.
Great job! The global environment was empty. Objects defined in the global environment can affect the analysis in your R Markdown file in unknown ways. For reproduciblity it’s best to always run the code in an empty environment.
The command set.seed(12345) was run prior to running the code in the R Markdown file. Setting a seed ensures that any results that rely on randomness, e.g. subsampling or permutations, are reproducible.
Great job! Recording the operating system, R version, and package versions is critical for reproducibility.
Nice! There were no cached chunks for this analysis, so you can be confident that you successfully produced the results during this run.
Great! You are using Git for version control. Tracking code development and connecting the code version to the results is critical for reproducibility. The version displayed above was the version of the Git repository at the time these results were generated.
Note that you need to be careful to ensure that all relevant files for the analysis have been committed to Git prior to generating the results (you can use wflow_publish or wflow_git_commit). workflowr only checks the R Markdown file, but you know if there are other scripts or data files that it depends on. Below is the status of the Git repository when the results were generated:
Ignored files:
    Ignored:    .DS_Store
    Ignored:    .Rhistory
    Ignored:    .Rproj.user/
    Ignored:    data/.DS_Store
    Ignored:    data/perm_QTL_trans_noMP_5percov/
    Ignored:    output/.DS_Store

Untracked files:
    Untracked:  KalistoAbundance18486.txt
    Untracked:  analysis/4suDataIGV.Rmd
    Untracked:  analysis/DirectionapaQTL.Rmd
    Untracked:  analysis/EvaleQTLs.Rmd
    Untracked:  analysis/YL_QTL_test.Rmd
    Untracked:  analysis/ncbiRefSeq_sm.sort.mRNA.bed
    Untracked:  analysis/snake.config.notes.Rmd
    Untracked:  analysis/verifyBAM.Rmd
    Untracked:  analysis/verifybam_dubs.Rmd
    Untracked:  code/PeaksToCoverPerReads.py
    Untracked:  code/strober_pc_pve_heatmap_func.R
    Untracked:  data/18486.genecov.txt
    Untracked:  data/APApeaksYL.total.inbrain.bed
    Untracked:  data/ApaQTLs/
    Untracked:  data/ChromHmmOverlap/
    Untracked:  data/DistTXN2Peak_genelocAnno/
    Untracked:  data/GM12878.chromHMM.bed
    Untracked:  data/GM12878.chromHMM.txt
    Untracked:  data/LianoglouLCL/
    Untracked:  data/LocusZoom/
    Untracked:  data/NuclearApaQTLs.txt
    Untracked:  data/PeakCounts/
    Untracked:  data/PeakCounts_noMP_5perc/
    Untracked:  data/PeakCounts_noMP_genelocanno/
    Untracked:  data/PeakUsage/
    Untracked:  data/PeakUsage_noMP/
    Untracked:  data/PeakUsage_noMP_GeneLocAnno/
    Untracked:  data/PeaksUsed/
    Untracked:  data/PeaksUsed_noMP_5percCov/
    Untracked:  data/RNAkalisto/
    Untracked:  data/RefSeq_annotations/
    Untracked:  data/TotalApaQTLs.txt
    Untracked:  data/Totalpeaks_filtered_clean.bed
    Untracked:  data/UnderstandPeaksQC/
    Untracked:  data/WASP_STAT/
    Untracked:  data/YL-SP-18486-T-combined-genecov.txt
    Untracked:  data/YL-SP-18486-T_S9_R1_001-genecov.txt
    Untracked:  data/YL_QTL_test/
    Untracked:  data/apaExamp/
    Untracked:  data/apaQTL_examp_noMP/
    Untracked:  data/bedgraph_peaks/
    Untracked:  data/bin200.5.T.nuccov.bed
    Untracked:  data/bin200.Anuccov.bed
    Untracked:  data/bin200.nuccov.bed
    Untracked:  data/clean_peaks/
    Untracked:  data/comb_map_stats.csv
    Untracked:  data/comb_map_stats.xlsx
    Untracked:  data/comb_map_stats_39ind.csv
    Untracked:  data/combined_reads_mapped_three_prime_seq.csv
    Untracked:  data/diff_iso_GeneLocAnno/
    Untracked:  data/diff_iso_proc/
    Untracked:  data/diff_iso_trans/
    Untracked:  data/ensemble_to_genename.txt
    Untracked:  data/example_gene_peakQuant/
    Untracked:  data/explainProtVar/
    Untracked:  data/filtPeakOppstrand_cov_noMP_GeneLocAnno_5perc/
    Untracked:  data/filtered_APApeaks_merged_allchrom_refseqTrans.closest2End.bed
    Untracked:  data/filtered_APApeaks_merged_allchrom_refseqTrans.closest2End.noties.bed
    Untracked:  data/first50lines_closest.txt
    Untracked:  data/gencov.test.csv
    Untracked:  data/gencov.test.txt
    Untracked:  data/gencov_zero.test.csv
    Untracked:  data/gencov_zero.test.txt
    Untracked:  data/gene_cov/
    Untracked:  data/joined
    Untracked:  data/leafcutter/
    Untracked:  data/merged_combined_YL-SP-threeprimeseq.bg
    Untracked:  data/molPheno_noMP/
    Untracked:  data/mol_overlap/
    Untracked:  data/mol_pheno/
    Untracked:  data/nom_QTL/
    Untracked:  data/nom_QTL_opp/
    Untracked:  data/nom_QTL_trans/
    Untracked:  data/nuc6up/
    Untracked:  data/nuc_10up/
    Untracked:  data/other_qtls/
    Untracked:  data/pQTL_otherphen/
    Untracked:  data/peakPerRefSeqGene/
    Untracked:  data/perm_QTL/
    Untracked:  data/perm_QTL_GeneLocAnno_noMP_5percov/
    Untracked:  data/perm_QTL_GeneLocAnno_noMP_5percov_3UTR/
    Untracked:  data/perm_QTL_opp/
    Untracked:  data/perm_QTL_trans/
    Untracked:  data/perm_QTL_trans_filt/
    Untracked:  data/protAndAPAAndExplmRes.Rda
    Untracked:  data/protAndAPAlmRes.Rda
    Untracked:  data/protAndExpressionlmRes.Rda
    Untracked:  data/reads_mapped_three_prime_seq.csv
    Untracked:  data/smash.cov.results.bed
    Untracked:  data/smash.cov.results.csv
    Untracked:  data/smash.cov.results.txt
    Untracked:  data/smash_testregion/
    Untracked:  data/ssFC200.cov.bed
    Untracked:  data/temp.file1
    Untracked:  data/temp.file2
    Untracked:  data/temp.gencov.test.txt
    Untracked:  data/temp.gencov_zero.test.txt
    Untracked:  data/threePrimeSeqMetaData.csv
    Untracked:  data/threePrimeSeqMetaData55Ind.txt
    Untracked:  data/threePrimeSeqMetaData55Ind.xlsx
    Untracked:  data/threePrimeSeqMetaData55Ind_noDup.txt
    Untracked:  data/threePrimeSeqMetaData55Ind_noDup.xlsx
    Untracked:  data/threePrimeSeqMetaData55Ind_noDup_WASPMAP.txt
    Untracked:  data/threePrimeSeqMetaData55Ind_noDup_WASPMAP.xlsx
    Untracked:  output/picard/
    Untracked:  output/plots/
    Untracked:  output/qual.fig2.pdf

Unstaged changes:
    Modified:   analysis/28ind.peak.explore.Rmd
    Modified:   analysis/CompareLianoglouData.Rmd
    Modified:   analysis/NewPeakPostMP.Rmd
    Modified:   analysis/apaQTLoverlapGWAS.Rmd
    Modified:   analysis/cleanupdtseq.internalpriming.Rmd
    Modified:   analysis/coloc_apaQTLs_protQTLs.Rmd
    Modified:   analysis/dif.iso.usage.leafcutter.Rmd
    Modified:   analysis/diff_iso_pipeline.Rmd
    Modified:   analysis/explainpQTLs.Rmd
    Modified:   analysis/explore.filters.Rmd
    Modified:   analysis/flash2mash.Rmd
    Modified:   analysis/mispriming_approach.Rmd
    Modified:   analysis/overlapMolQTL.Rmd
    Modified:   analysis/overlapMolQTL.opposite.Rmd
    Modified:   analysis/overlap_qtls.Rmd
    Modified:   analysis/peakOverlap_oppstrand.Rmd
    Modified:   analysis/peakQCPPlots.Rmd
    Modified:   analysis/pheno.leaf.comb.Rmd
    Modified:   analysis/pipeline_55Ind.Rmd
    Modified:   analysis/swarmPlots_QTLs.Rmd
    Modified:   analysis/test.max2.Rmd
    Modified:   analysis/test.smash.Rmd
    Modified:   analysis/understandPeaks.Rmd
    Modified:   code/Snakefile
Note that any generated files, e.g. HTML, png, CSS, etc., are not included in this status report because it is ok for generated content to have uncommitted changes.
These are the previous versions of the R Markdown and HTML files. If you’ve configured a remote Git repository (see ?wflow_git_remote), click on the hyperlinks in the table below to view them.
| File | Version | Author | Date | Message |
|---|---|---|---|---|
| html | 07a4b77 | Briana Mittleman | 2018-11-20 | Build site. |
| Rmd | 58d62bb | Briana Mittleman | 2018-11-20 | add 2 more examples |
| html | 4edece5 | Briana Mittleman | 2018-11-19 | Build site. |
| Rmd | bac8c20 | Briana Mittleman | 2018-11-19 | export files for locus zoom site |
| html | 0940e7c | Briana Mittleman | 2018-11-16 | Build site. |
| Rmd | a856d09 | Briana Mittleman | 2018-11-16 | fix format |
| html | 410f25c | Briana Mittleman | 2018-11-16 | Build site. |
| Rmd | eca9b13 | Briana Mittleman | 2018-11-16 | add samcl1 |
| html | b2b7368 | Briana Mittleman | 2018-11-16 | Build site. |
| Rmd | 4fb0d81 | Briana Mittleman | 2018-11-16 | add more examples |
| html | 617a3b7 | Briana Mittleman | 2018-11-15 | Build site. |
| Rmd | e79d21a | Briana Mittleman | 2018-11-15 | add LD color to plot |
| html | 813a500 | Briana Mittleman | 2018-11-15 | Build site. |
| Rmd | 23c62c9 | Briana Mittleman | 2018-11-15 | add locus zoom initial analysis |
In this analysis I will create locus zoom plots for the example QTLs that look to be associated in APA and protein but not in RNA.
EIF2A
I will first do this for the EIF2A totalAPA example. peak228606, 3:150302010.
To run this analysis, I will need the nominal pvalues for this peak/gene. I can then plot the snp location against the pvalue. After I have this working, I can add the r2 values.
EIF2A==ENSG00000144895
grep EIF2A /project2/gilad/briana/genome_anotation_data/ensemble_to_genename.txt
grep peak228606 /project2/gilad/briana/threeprimeseq/data/nominal_APAqtl_trans/filtered_APApeaks_merged_allchrom_refseqGenes_pheno_Total_NomRes.txt > /project2/gilad/briana/threeprimeseq/data/LocusZoom/TotalAPA.peak228606.EIF2A.nomTotal.txt


grep ENSG00000144895 /project2/gilad/briana/threeprimeseq/data/molecular_QTLs/nom/fastqtl_qqnorm_RNAseq_phase2.fixed.nominal.out > /project2/gilad/briana/threeprimeseq/data/LocusZoom/RNA.EIF2A.nomTotal.txt

grep ENSG00000144895 /project2/gilad/briana/threeprimeseq/data/molecular_QTLs/nom/fastqtl_qqnorm_prot.fixed.nominal.out > /project2/gilad/briana/threeprimeseq/data/LocusZoom/Prot.EIF2A.nomTotal.txt

 grep ENSG00000144895 /project2/gilad/briana/threeprimeseq/data/molecular_QTLs/nom/fastqtl_qqnorm_ribo_phase2.fixed.nominal.out > /project2/gilad/briana/threeprimeseq/data/LocusZoom/Ribo.EIF2A.nomTotal.txt
FastQTL results for nominal: * phenoID
SID
Distance
Nominal Pval
Slope
Librarys
library(workflowr)This is workflowr version 1.2.0
Run ?workflowr for help getting startedlibrary(reshape2)
library(tidyverse)── Attaching packages ───────────────────────────────────────────────────────────── tidyverse 1.2.1 ──✔ ggplot2 3.0.0 ✔ purrr 0.2.5
✔ tibble 1.4.2 ✔ dplyr 0.7.6
✔ tidyr 0.8.1 ✔ stringr 1.4.0
✔ readr 1.1.1 ✔ forcats 0.3.0Warning: package 'stringr' was built under R version 3.5.2── Conflicts ──────────────────────────────────────────────────────────────── tidyverse_conflicts() ──
✖ dplyr::filter() masks stats::filter()
✖ dplyr::lag() masks stats::lag()library(VennDiagram)Loading required package: gridLoading required package: futile.loggerlibrary(data.table)
Attaching package: 'data.table'The following objects are masked from 'package:dplyr':
between, first, lastThe following object is masked from 'package:purrr':
transposeThe following objects are masked from 'package:reshape2':
dcast, meltlibrary(ggpubr)Loading required package: magrittr
Attaching package: 'magrittr'The following object is masked from 'package:purrr':
set_namesThe following object is masked from 'package:tidyr':
extract
Attaching package: 'ggpubr'The following object is masked from 'package:VennDiagram':
rotatelibrary(cowplot)
Attaching package: 'cowplot'The following object is masked from 'package:ggpubr':
get_legendThe following object is masked from 'package:ggplot2':
ggsaveAPA=read.table("../data/LocusZoom/TotalAPA.peak228606.EIF2A.nomTotal.txt", stringsAsFactors = F, col.names = c("PeakID", "SID", "Dist", "APAPval","slope")) %>% separate(SID, into=c("Chrom", "Location"), sep=":") %>% select( Location, APAPval)
APA$Location=as.integer(APA$Location)
Prot=read.table("../data/LocusZoom/Prot.EIF2A.nomTotal.txt", stringsAsFactors = F, col.names = c("PeakID", "SID", "Dist", "ProtPval","slope")) %>% separate(SID, into=c("Chrom", "Location"), sep=":")%>% select( Location, ProtPval)
Prot$Location=as.integer(Prot$Location)
RNA=read.table("../data/LocusZoom/RNA.EIF2A.nomTotal.txt", stringsAsFactors = F, col.names = c("PeakID", "SID", "Dist", "RnaPval","slope")) %>% separate(SID, into=c("Chrom", "Location"), sep=":")%>% select( Location, RnaPval)
RNA$Location=as.integer(RNA$Location)
Ribo=read.table("../data/LocusZoom/Ribo.EIF2A.nomTotal.txt", stringsAsFactors = F, col.names = c("PeakID", "SID", "Dist", "RiboPval","slope")) %>% separate(SID, into=c("Chrom", "Location"), sep=":")%>% select( Location, RiboPval)
Ribo$Location=as.integer(Ribo$Location)I can join these by the snps that are tested for all three.
allPheno=APA %>% inner_join(Prot, by="Location") %>% inner_join(Ribo, by="Location") %>% inner_join(RNA, by="Location")First I can just plot these as is and see what happens:
allPhen_melt= melt(allPheno, id.vars="Location")ggplot(allPhen_melt,aes(x=Location, y=value)) + geom_point() + facet_grid( rows=vars(variable))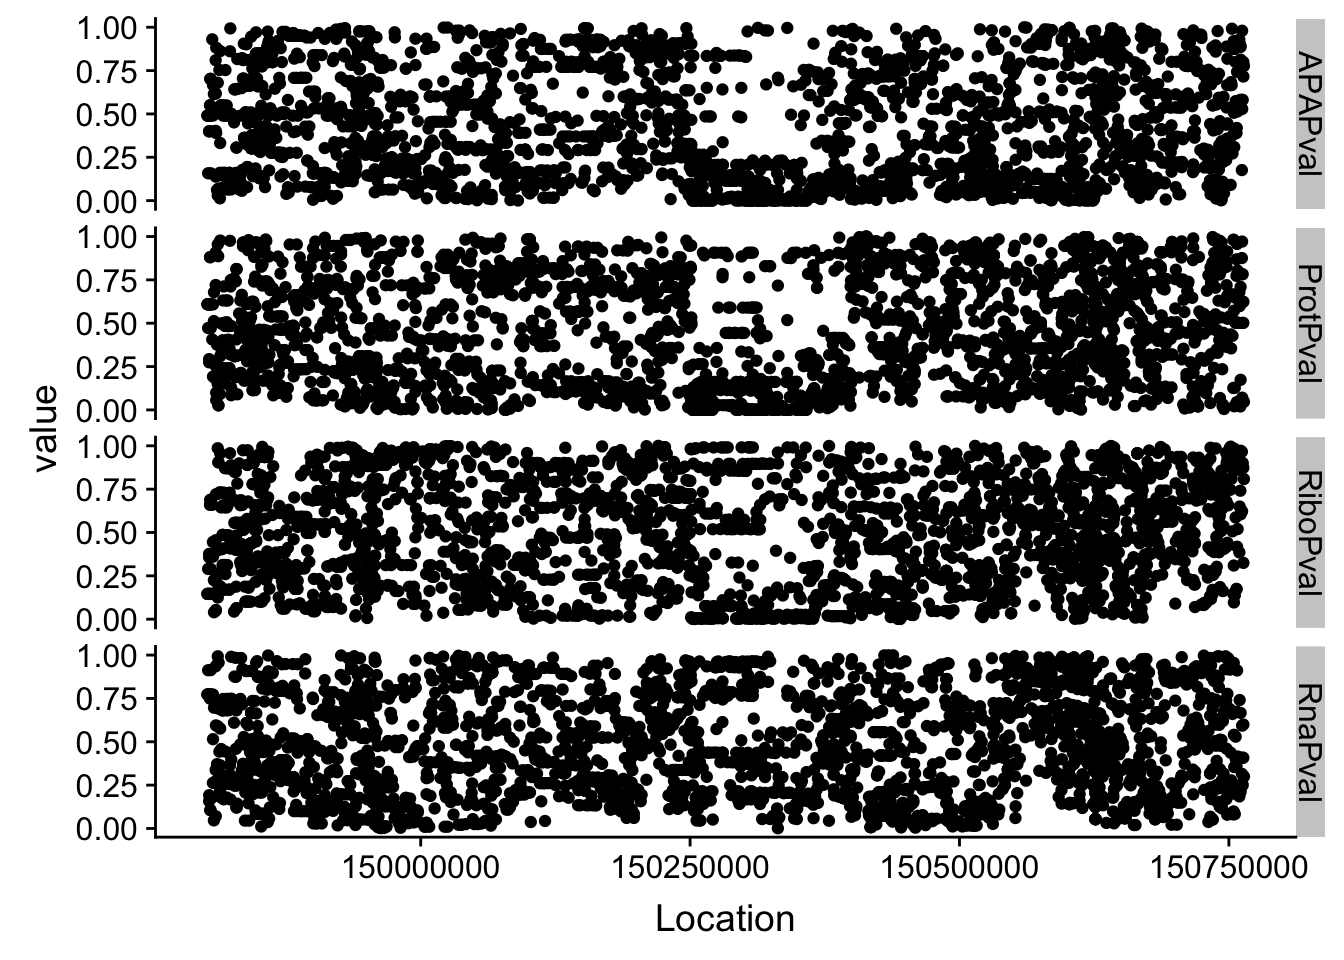
I need to zoom in around my locus 150302010
allPheno_filt=allPheno %>% filter(Location> 150297010 & Location < 150307010)

allPhen_filt_melt= melt(allPheno_filt, id.vars="Location")

ggplot(allPhen_filt_melt,aes(x=Location, y=-log10(value))) + geom_point() + facet_grid( rows=vars(variable)) + geom_vline(xintercept=150302010, linetype="dashed", color = "red") + theme(axis.line=element_line()) + theme(panel.grid.major = element_line("lightgray",0.25), panel.grid.minor = element_line("lightgray",0.25)) + labs(x="Chromosome 3 Location", y="-Log 10 Pvalue", title="Locus Zoom for EIF2A:peak228606")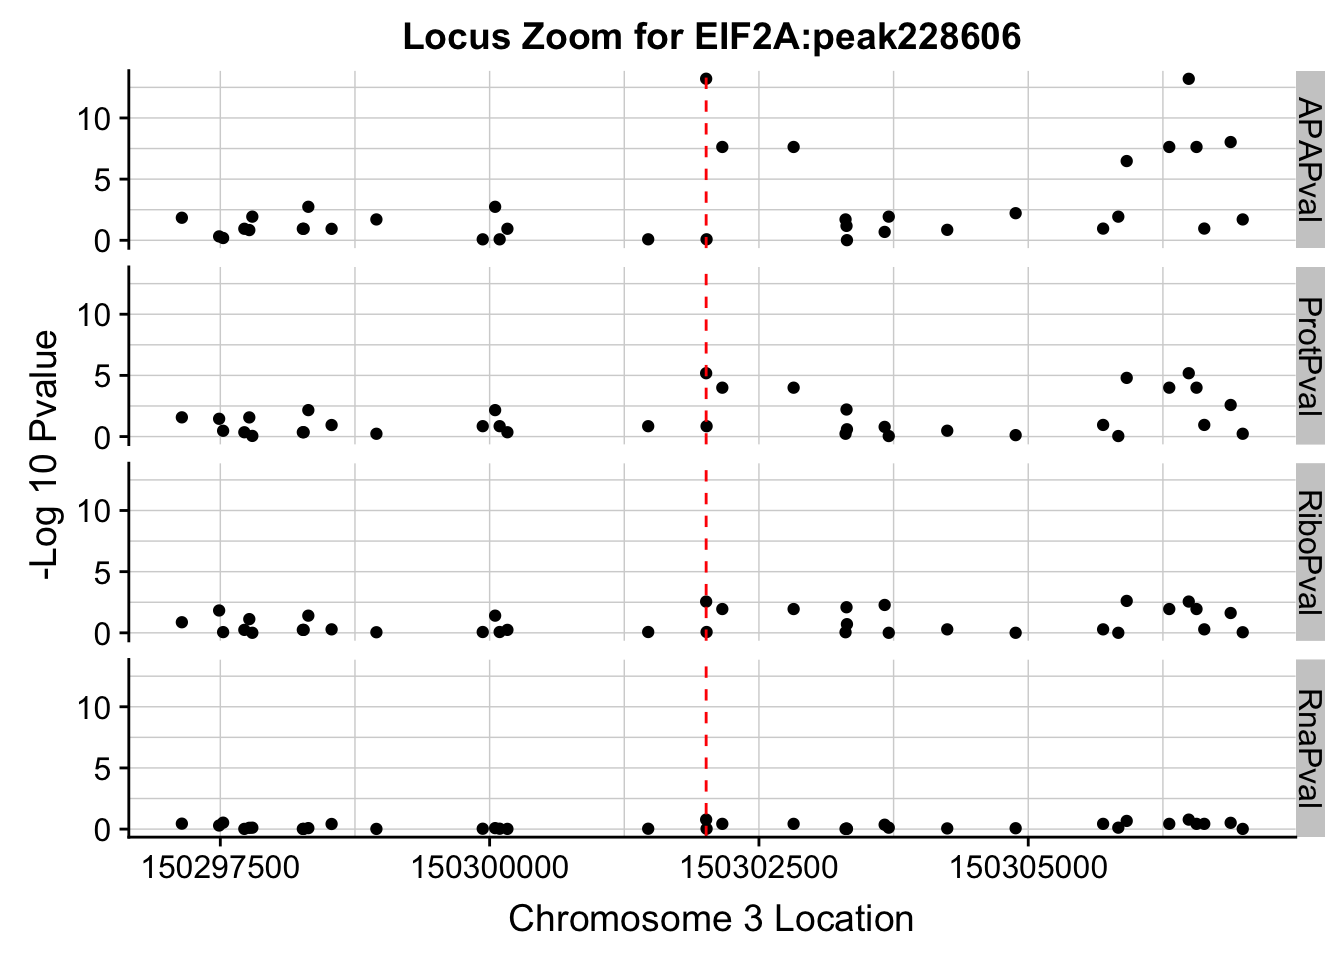
Plot each seperatly because power is different.
ggplot(allPhen_filt_melt,aes(x=Location, y=-log10(value))) + geom_point() + facet_grid( rows=vars(variable),scales="free") + geom_vline(xintercept=150302010, linetype="dashed", color = "red") + theme(axis.line=element_line()) + theme(panel.grid.major = element_line("lightgray",0.25), panel.grid.minor = element_line("lightgray",0.25)) + labs(x="Chromosome 3 Location", y="-Log 10 Pvalue", title="Locus Zoom for EIF2A:peak228606")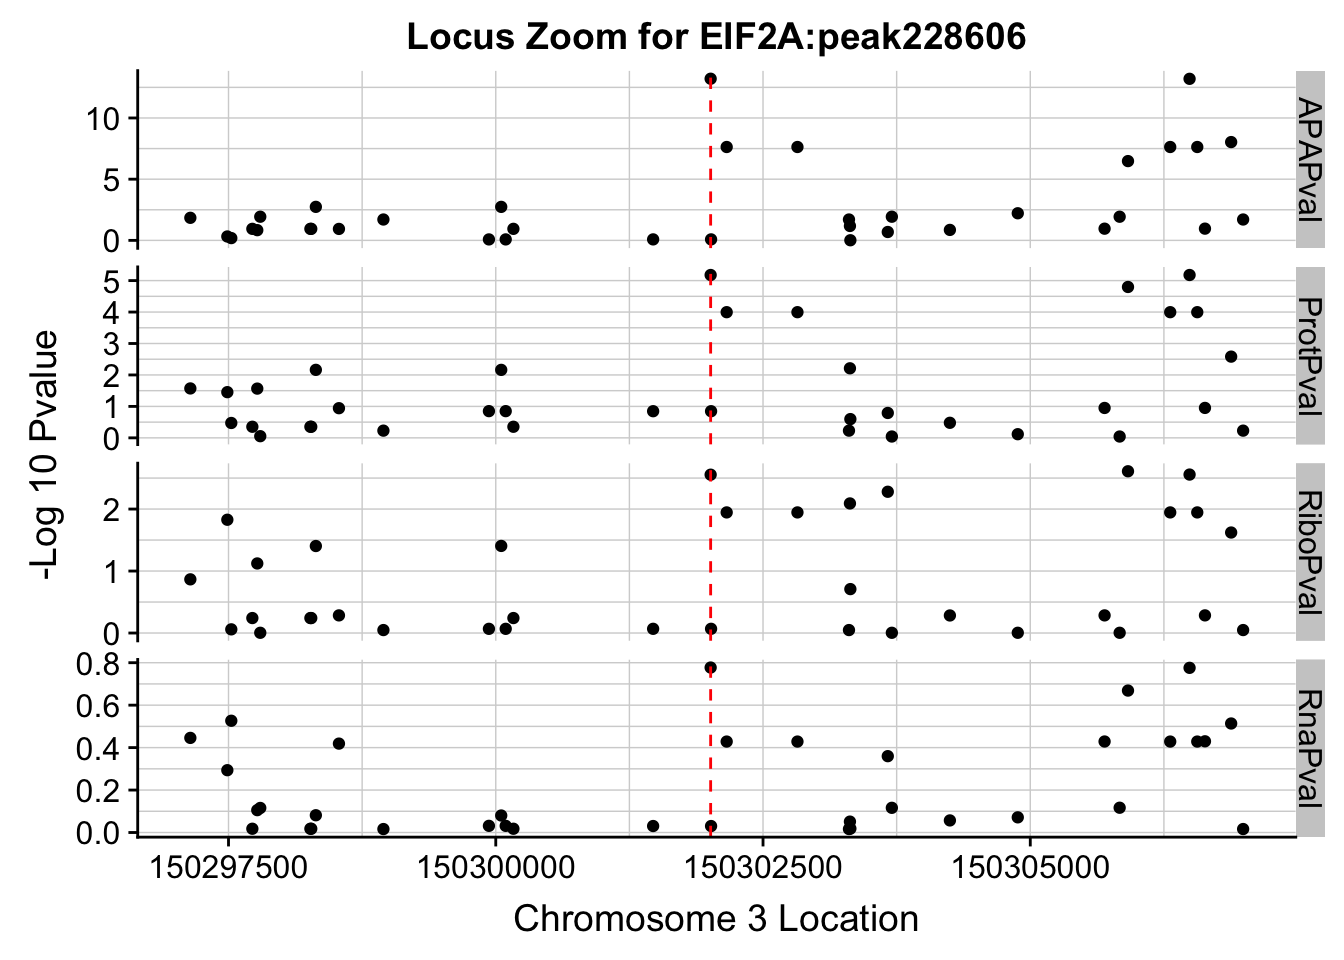
| Version | Author | Date |
|---|---|---|
| b2b7368 | Briana Mittleman | 2018-11-16 |
The next step is to add the LD structure. I can do this with PLINK and the files I made for the GWAS overlap.
RunPlink_EIF2A.sh
#!/bin/bash

#SBATCH --job-name=RunPlink_EIF2A
#SBATCH --account=pi-yangili1
#SBATCH --time=36:00:00
#SBATCH --output=RunPlink_EIF2A.out
#SBATCH --error=RunPlink_EIF2A.err
#SBATCH --partition=broadwl
#SBATCH --mem=30G
#SBATCH --mail-type=END

module load plink


plink --ped /project2/gilad/briana/YRI_geno_hg19/plinkYRIgeno_chr3.ped  --map /project2/gilad/briana/YRI_geno_hg19/plinkYRIgeno_chr3.map --r2  --ld-snp 3:150302010 --ld-window-kb 1000 --ld-window 99999  --out /project2/gilad/briana/threeprimeseq/data/LocusZoom/EIF2A_leadsnp.txt
LD_structure=read.table("../data/LocusZoom/EIF2A_leadsnp.txt.ld", header=T) %>% select(BP_B, R2)
colnames(LD_structure)=c("Location", "R2")
allPheno_filt2=allPheno %>% filter(Location> 150292010 & Location < 150312010)
allPheno_filt_LD=allPheno_filt2 %>% inner_join(LD_structure, by="Location")
allPheno_filt_LD_melt=melt(allPheno_filt_LD, id.vars=c("Location", "R2"))lockedscale=ggplot(allPheno_filt_LD_melt, aes(x=Location, y=-log10(value), col=R2)) + geom_point() + facet_grid( rows=vars(variable)) + geom_vline(xintercept=150302010, linetype="dashed", color = "red") + theme_linedraw()
freescale=ggplot(allPheno_filt_LD_melt, aes(x=Location, y=-log10(value), col=R2)) + geom_point() + facet_grid( rows=vars(variable), scales = "free") + geom_vline(xintercept=150302010, linetype="dashed", color = "red") + theme_linedraw()plot_grid(lockedscale,freescale, align = "v", ncol=1)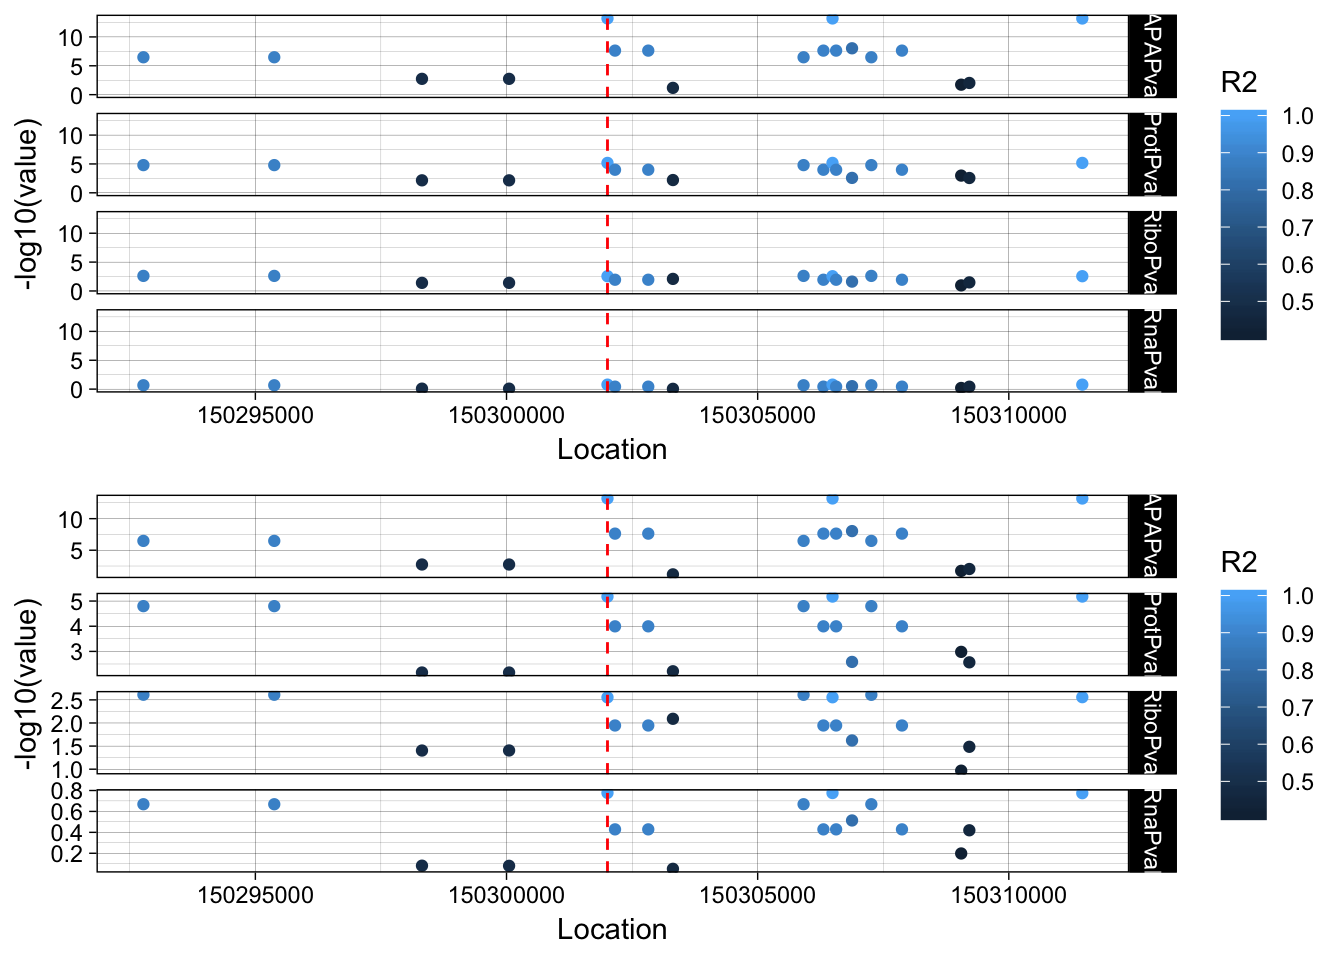
| Version | Author | Date |
|---|---|---|
| b2b7368 | Briana Mittleman | 2018-11-16 |
Try on the same plot:
ggplot(allPheno_filt_LD_melt, aes(x=Location, y=-log10(value), col=variable, by =variable)) + geom_point() + geom_vline(xintercept=150302010, linetype="dashed", color = "red") + theme_linedraw()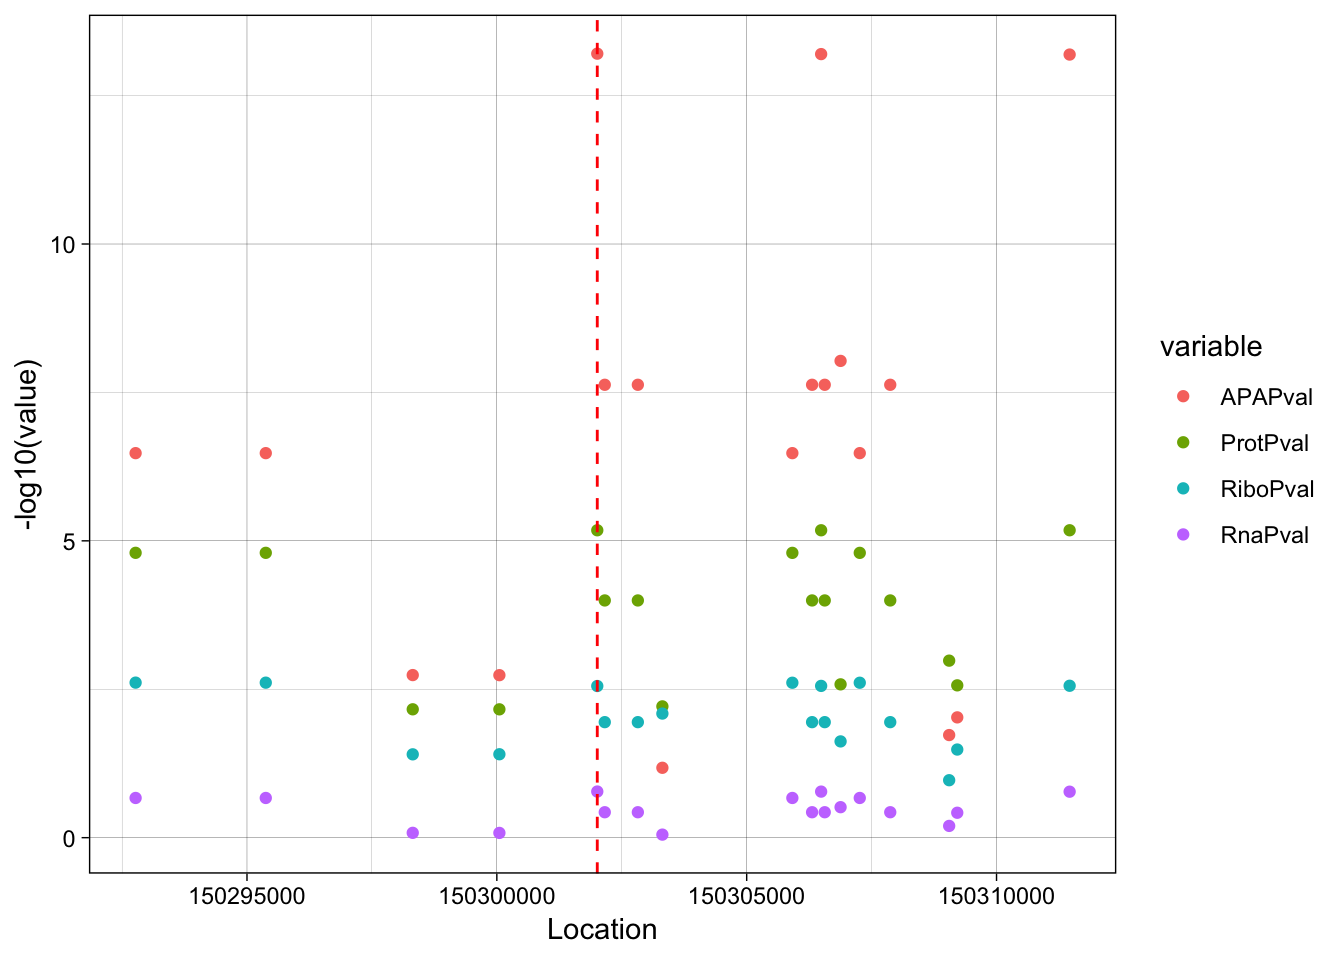
| Version | Author | Date |
|---|---|---|
| b2b7368 | Briana Mittleman | 2018-11-16 |
rs14434 https://www.ncbi.nlm.nih.gov/variation/view/?q=rs14434&assm=GCF_000001405.33
RINT1
RINT1 is a nuclear QTL. peak303436 7:105155320 ENSG00000135249
grep peak303436  /project2/gilad/briana/threeprimeseq/data/nominal_APAqtl_trans/filtered_APApeaks_merged_allchrom_refseqGenes_pheno_Nuclear_NomRes.txt > /project2/gilad/briana/threeprimeseq/data/LocusZoom/TotalAPA.peak303436.RINT1.nomNuc.txt

grep peak303436  /project2/gilad/briana/threeprimeseq/data/nominal_APAqtl_trans/filtered_APApeaks_merged_allchrom_refseqGenes_pheno_Total_NomRes.txt > /project2/gilad/briana/threeprimeseq/data/LocusZoom/TotalAPA.peak303436.RINT1.nomTotal.txt

grep ENSG00000135249 /project2/gilad/briana/threeprimeseq/data/molecular_QTLs/nom/fastqtl_qqnorm_RNAseq_phase2.fixed.nominal.out > /project2/gilad/briana/threeprimeseq/data/LocusZoom/RNA.RINT1.nomTotal.txt

grep ENSG00000135249 /project2/gilad/briana/threeprimeseq/data/molecular_QTLs/nom/fastqtl_qqnorm_prot.fixed.nominal.out > /project2/gilad/briana/threeprimeseq/data/LocusZoom/Prot.RINT1.nomTotal.txt

 grep ENSG00000135249 /project2/gilad/briana/threeprimeseq/data/molecular_QTLs/nom/fastqtl_qqnorm_ribo_phase2.fixed.nominal.out > /project2/gilad/briana/threeprimeseq/data/LocusZoom/Ribo.RINT1.nomTotal.txt
RunPlink_RINT1.sh
#!/bin/bash

#SBATCH --job-name=RunPlink_RINT1
#SBATCH --account=pi-yangili1
#SBATCH --time=36:00:00
#SBATCH --output=RunPlink_RINT1.out
#SBATCH --error=RunPlink_RINT1.err
#SBATCH --partition=broadwl
#SBATCH --mem=30G
#SBATCH --mail-type=END

module load plink


plink --ped /project2/gilad/briana/YRI_geno_hg19/plinkYRIgeno_chr7.ped  --map /project2/gilad/briana/YRI_geno_hg19/plinkYRIgeno_chr7.map --r2  --ld-snp 7:105155320 --ld-window-kb 1000 --ld-window 99999  --out /project2/gilad/briana/threeprimeseq/data/LocusZoom/RINT1_leadsnp
APA_Total_RINT1=read.table("../data/LocusZoom/TotalAPA.peak303436.RINT1.nomTotal.txt", stringsAsFactors = F, col.names = c("PeakID", "SID", "Dist", "APA_TotalPval","slope")) %>% separate(SID, into=c("Chrom", "Location"), sep=":") %>% select( Location, APA_TotalPval)
APA_Total_RINT1$Location=as.integer(APA_Total_RINT1$Location)
APA_Nuclear_RINT1=read.table("../data/LocusZoom/TotalAPA.peak303436.RINT1.nomNuc.txt", stringsAsFactors = F, col.names = c("PeakID", "SID", "Dist", "APA_NuclearPval","slope")) %>% separate(SID, into=c("Chrom", "Location"), sep=":") %>% select( Location, APA_NuclearPval)
APA_Nuclear_RINT1$Location=as.integer(APA_Nuclear_RINT1$Location)
Prot_RINT1=read.table("../data/LocusZoom/Prot.RINT1.nomTotal.txt", stringsAsFactors = F, col.names = c("PeakID", "SID", "Dist", "ProtPval","slope")) %>% separate(SID, into=c("Chrom", "Location"), sep=":")%>% select( Location, ProtPval)
Prot_RINT1$Location=as.integer(Prot_RINT1$Location)
RNA_RINT1=read.table("../data/LocusZoom/RNA.RINT1.nomTotal.txt", stringsAsFactors = F, col.names = c("PeakID", "SID", "Dist", "RnaPval","slope")) %>% separate(SID, into=c("Chrom", "Location"), sep=":")%>% select( Location, RnaPval)
RNA_RINT1$Location=as.integer(RNA_RINT1$Location)
Ribo_RINT1=read.table("../data/LocusZoom/Ribo.RINT1.nomTotal.txt", stringsAsFactors = F, col.names = c("PeakID", "SID", "Dist", "RiboPval","slope")) %>% separate(SID, into=c("Chrom", "Location"), sep=":")%>% select( Location, RiboPval)
Ribo_RINT1$Location=as.integer(Ribo_RINT1$Location)
LD_structure_RINT1=read.table("../data/LocusZoom/RINT1_leadsnp.ld", header=T) %>% select(BP_B, R2)
colnames(LD_structure_RINT1)=c("Location", "R2")I can join these by the snps that are tested for all three. Filter 1kb up and downstream
allPheno_RINT1=APA_Total_RINT1 %>% inner_join(APA_Nuclear_RINT1, by="Location") %>% inner_join(Prot_RINT1, by="Location") %>% inner_join(Ribo_RINT1, by="Location") %>% inner_join(RNA_RINT1, by="Location") %>% inner_join(LD_structure_RINT1, by="Location") %>% filter(Location> 105154320 & Location < 105156320)

allPheno_RINT1_melt=melt(allPheno_RINT1, id.vars=c("Location", "R2"))


lockedscale_RINT1=ggplot(allPheno_RINT1_melt, aes(x=Location, y=-log10(value), col=R2)) +  geom_point() + facet_grid( rows=vars(variable)) + geom_vline(xintercept=105155320, linetype="dashed", color = "red") +  theme_linedraw()


freescale_RINT1=ggplot(allPheno_RINT1_melt, aes(x=Location, y=-log10(value), col=R2)) +  geom_point() + facet_grid( rows=vars(variable), scales = "free") + geom_vline(xintercept=105155320, linetype="dashed", color = "red") +  theme_linedraw()


plot_grid(lockedscale_RINT1,freescale_RINT1, align = "v", ncol=1)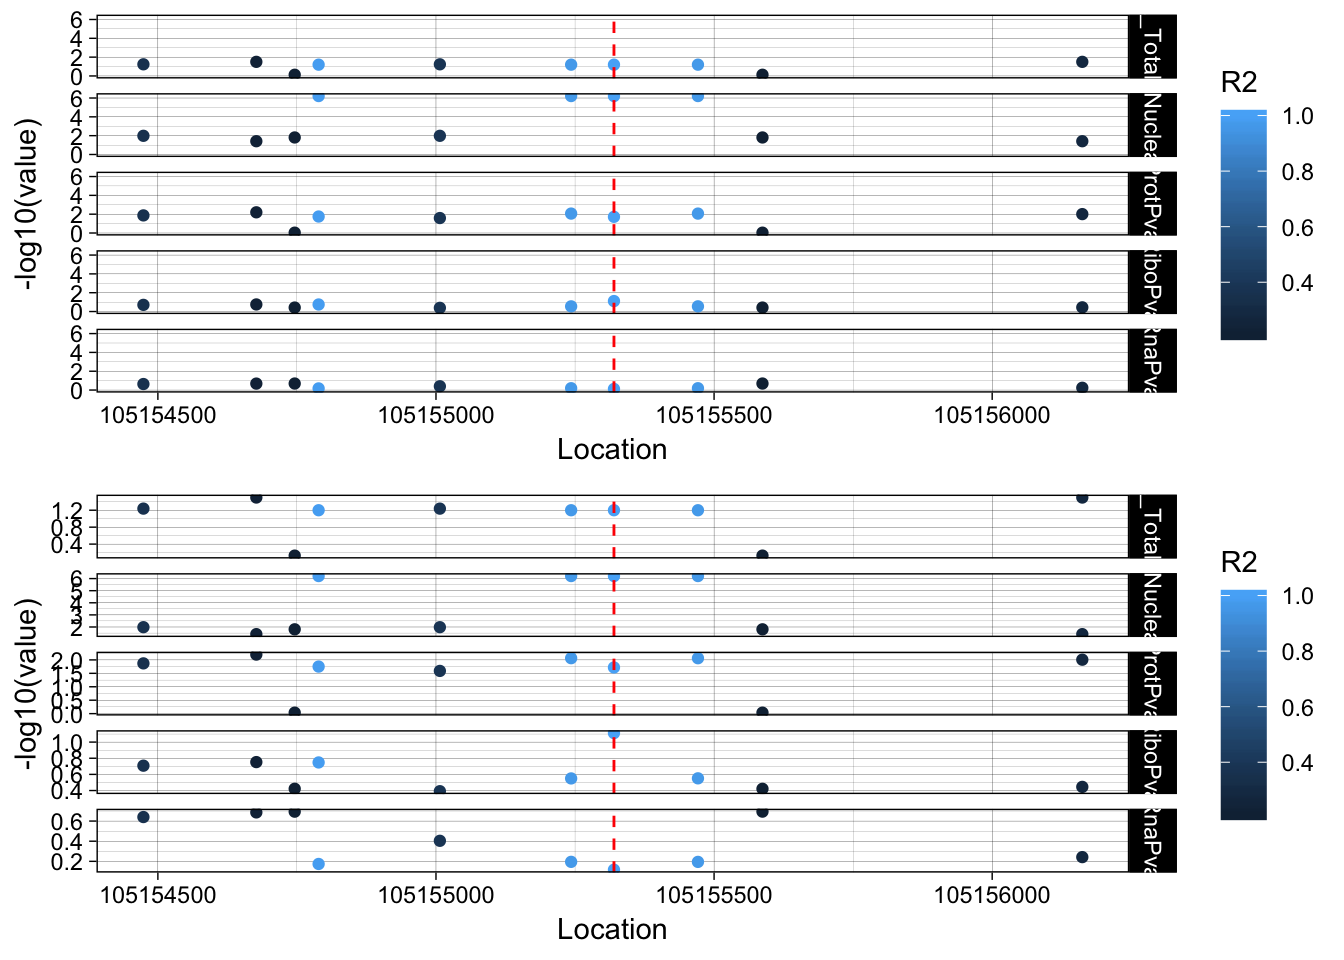
| Version | Author | Date |
|---|---|---|
| b2b7368 | Briana Mittleman | 2018-11-16 |
rs2463632 (7:105155320): it is an intronic variant in PUS7
PUS7 chr7:105,080,108-105,162,714 RINT1 chr7:105,172,532-105,208,124
This snp is in the intron on the gene directly upstream of RINT1.
LYAR
This is a nuclear QTL as well. peak235215 4:4196045 ENSG00000145220
RunLocusZoom_LYAR.sh
#!/bin/bash

#SBATCH --job-name=RunLocusZoom_LYAR
#SBATCH --account=pi-yangili1
#SBATCH --time=36:00:00
#SBATCH --output=RunLocusZoom_LYAR.out
#SBATCH --error=RunLocusZoom_LYAR.err
#SBATCH --partition=broadwl
#SBATCH --mem=30G
#SBATCH --mail-type=END

module load plink


grep peak235215  /project2/gilad/briana/threeprimeseq/data/nominal_APAqtl_trans/filtered_APApeaks_merged_allchrom_refseqGenes_pheno_Nuclear_NomRes.txt > /project2/gilad/briana/threeprimeseq/data/LocusZoom/NuclearAPA.peak303436.LYAR.nomNuc.txt

grep peak235215  /project2/gilad/briana/threeprimeseq/data/nominal_APAqtl_trans/filtered_APApeaks_merged_allchrom_refseqGenes_pheno_Total_NomRes.txt > /project2/gilad/briana/threeprimeseq/data/LocusZoom/TotalAPA.peak303436.LYAR.nomTotal.txt

grep ENSG00000145220 /project2/gilad/briana/threeprimeseq/data/molecular_QTLs/nom/fastqtl_qqnorm_RNAseq_phase2.fixed.nominal.out > /project2/gilad/briana/threeprimeseq/data/LocusZoom/RNA.LYAR.nomTotal.txt

grep ENSG00000145220 /project2/gilad/briana/threeprimeseq/data/molecular_QTLs/nom/fastqtl_qqnorm_prot.fixed.nominal.out > /project2/gilad/briana/threeprimeseq/data/LocusZoom/Prot.LYAR.nomTotal.txt

 grep ENSG00000145220 /project2/gilad/briana/threeprimeseq/data/molecular_QTLs/nom/fastqtl_qqnorm_ribo_phase2.fixed.nominal.out > /project2/gilad/briana/threeprimeseq/data/LocusZoom/Ribo.LYAR.nomTotal.txt


plink --ped /project2/gilad/briana/YRI_geno_hg19/plinkYRIgeno_chr4.ped  --map /project2/gilad/briana/YRI_geno_hg19/plinkYRIgeno_chr4.map --r2  --ld-snp 4:4196045 --ld-window-kb 1000 --ld-window 99999  --out /project2/gilad/briana/threeprimeseq/data/LocusZoom/LYAR_leadsnp.txt
Move to my computer:
APA_Total_LYAR=read.table("../data/LocusZoom/TotalAPA.peak303436.LYAR.nomTotal.txt", stringsAsFactors = F, col.names = c("PeakID", "SID", "Dist", "APA_TotalPval","slope")) %>% separate(SID, into=c("Chrom", "Location"), sep=":") %>% select( Location, APA_TotalPval)
APA_Total_LYAR$Location=as.integer(APA_Total_LYAR$Location)

APA_Nuclear_LYAR=read.table("../data/LocusZoom/NuclearAPA.peak303436.LYAR.nomNuc.txt", stringsAsFactors = F, col.names = c("PeakID", "SID", "Dist", "APA_NuclearPval","slope")) %>% separate(SID, into=c("Chrom", "Location"), sep=":") %>% select( Location, APA_NuclearPval)
APA_Nuclear_LYAR$Location=as.integer(APA_Nuclear_LYAR$Location)

Prot_LYAR=read.table("../data/LocusZoom/Prot.LYAR.nomTotal.txt", stringsAsFactors = F, col.names = c("PeakID", "SID", "Dist", "ProtPval","slope")) %>% separate(SID, into=c("Chrom", "Location"), sep=":")%>% select( Location, ProtPval)
Prot_LYAR$Location=as.integer(Prot_LYAR$Location)
RNA_LYAR=read.table("../data/LocusZoom/RNA.LYAR.nomTotal.txt", stringsAsFactors = F, col.names = c("PeakID", "SID", "Dist", "RnaPval","slope")) %>% separate(SID, into=c("Chrom", "Location"), sep=":")%>% select( Location, RnaPval)
RNA_LYAR$Location=as.integer(RNA_LYAR$Location)
Ribo_LYAR=read.table("../data/LocusZoom/Ribo.LYAR.nomTotal.txt", stringsAsFactors = F, col.names = c("PeakID", "SID", "Dist", "RiboPval","slope")) %>% separate(SID, into=c("Chrom", "Location"), sep=":")%>% select( Location, RiboPval)
Ribo_LYAR$Location=as.integer(Ribo_LYAR$Location)

LD_structure_LYAR=read.table("../data/LocusZoom/LYAR_leadsnp.txt.ld", header=T) %>% select(BP_B, R2)
colnames(LD_structure_LYAR)=c("Location", "R2")


allPheno_LYAR=APA_Total_LYAR %>% inner_join(APA_Nuclear_LYAR, by="Location") %>% inner_join(Prot_LYAR, by="Location") %>% inner_join(Ribo_LYAR, by="Location") %>% inner_join(RNA_LYAR, by="Location") %>% inner_join(LD_structure_LYAR, by="Location") %>% filter(Location> 4191045 & Location < 4201045)

allPheno_LYAR_melt=melt(allPheno_LYAR, id.vars=c("Location", "R2"))


lockedscale_LYAR=ggplot(allPheno_LYAR_melt, aes(x=Location, y=-log10(value), col=R2)) +  geom_point() + facet_grid( rows=vars(variable)) + geom_vline(xintercept=4196045, linetype="dashed", color = "red") +  theme_linedraw()


freescale_LYAR=ggplot(allPheno_LYAR_melt, aes(x=Location, y=-log10(value), col=R2)) +  geom_point() + facet_grid( rows=vars(variable), scales = "free") + geom_vline(xintercept=4196045, linetype="dashed", color = "red") +  theme_linedraw()


plot_grid(lockedscale_LYAR,freescale_LYAR, align = "v", ncol=1)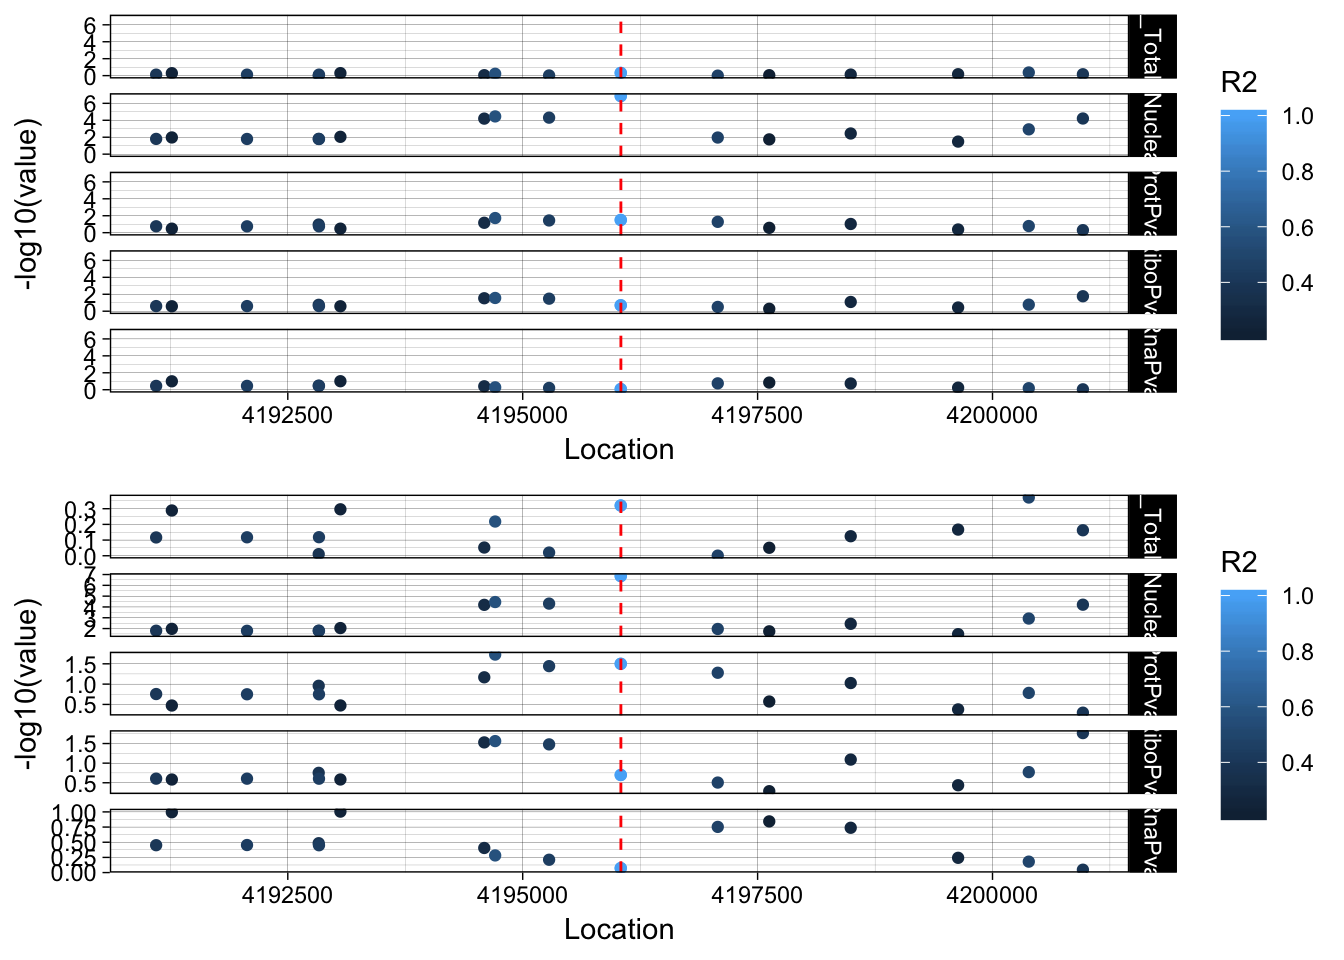
| Version | Author | Date |
|---|---|---|
| b2b7368 | Briana Mittleman | 2018-11-16 |
Snp is in an intron OTOP1 gene 2 genes upstream. rs7682186
PSMF1
Total QTL peak193648 20:1131308 ENSG00000125818
RunLocusZoom_PSMF1.sh
#!/bin/bash

#SBATCH --job-name=RunLocusZoom_PSMF1
#SBATCH --account=pi-yangili1
#SBATCH --time=36:00:00
#SBATCH --output=RunLocusZoom_PSMF1.out
#SBATCH --error=RunLocusZoom_PSMF1.err
#SBATCH --partition=broadwl
#SBATCH --mem=30G
#SBATCH --mail-type=END

module load plink


grep peak193648  /project2/gilad/briana/threeprimeseq/data/nominal_APAqtl_trans/filtered_APApeaks_merged_allchrom_refseqGenes_pheno_Nuclear_NomRes.txt > /project2/gilad/briana/threeprimeseq/data/LocusZoom/NuclearAPA.peak193648.PSMF1.nomNuc.txt

grep peak193648  /project2/gilad/briana/threeprimeseq/data/nominal_APAqtl_trans/filtered_APApeaks_merged_allchrom_refseqGenes_pheno_Total_NomRes.txt > /project2/gilad/briana/threeprimeseq/data/LocusZoom/TotalAPA.peak193648.PSMF1.nomTotal.txt

grep ENSG00000125818 /project2/gilad/briana/threeprimeseq/data/molecular_QTLs/nom/fastqtl_qqnorm_RNAseq_phase2.fixed.nominal.out > /project2/gilad/briana/threeprimeseq/data/LocusZoom/RNA.PSMF1.nomTotal.txt

grep ENSG00000125818 /project2/gilad/briana/threeprimeseq/data/molecular_QTLs/nom/fastqtl_qqnorm_prot.fixed.nominal.out > /project2/gilad/briana/threeprimeseq/data/LocusZoom/Prot.PSMF1.nomTotal.txt

 grep ENSG00000125818 /project2/gilad/briana/threeprimeseq/data/molecular_QTLs/nom/fastqtl_qqnorm_ribo_phase2.fixed.nominal.out > /project2/gilad/briana/threeprimeseq/data/LocusZoom/Ribo.PSMF1.nomTotal.txt


plink --ped /project2/gilad/briana/YRI_geno_hg19/plinkYRIgeno_chr20.ped  --map /project2/gilad/briana/YRI_geno_hg19/plinkYRIgeno_chr20.map --r2  --ld-snp 20:1131308 --ld-window-kb 1000 --ld-window 99999  --out /project2/gilad/briana/threeprimeseq/data/LocusZoom/PSMF1_leadsnp.txt
Move to computer
APA_Total_PSMF1=read.table("../data/LocusZoom/TotalAPA.peak193648.PSMF1.nomTotal.txt", stringsAsFactors = F, col.names = c("PeakID", "SID", "Dist", "APA_TotalPval","slope")) %>% separate(SID, into=c("Chrom", "Location"), sep=":") %>% select( Location, APA_TotalPval)
APA_Total_PSMF1$Location=as.integer(APA_Total_PSMF1$Location)

APA_Nuclear_PSMF1=read.table("../data/LocusZoom/NuclearAPA.peak193648.PSMF1.nomNuc.txt", stringsAsFactors = F, col.names = c("PeakID", "SID", "Dist", "APA_NuclearPval","slope")) %>% separate(SID, into=c("Chrom", "Location"), sep=":") %>% select( Location, APA_NuclearPval)
APA_Nuclear_PSMF1$Location=as.integer(APA_Nuclear_PSMF1$Location)

Prot_PSMF1=read.table("../data/LocusZoom/Prot.PSMF1.nomTotal.txt", stringsAsFactors = F, col.names = c("PeakID", "SID", "Dist", "ProtPval","slope")) %>% separate(SID, into=c("Chrom", "Location"), sep=":")%>% select( Location, ProtPval)
Prot_PSMF1$Location=as.integer(Prot_PSMF1$Location)
RNA_PSMF1=read.table("../data/LocusZoom/RNA.PSMF1.nomTotal.txt", stringsAsFactors = F, col.names = c("PeakID", "SID", "Dist", "RnaPval","slope")) %>% separate(SID, into=c("Chrom", "Location"), sep=":")%>% select( Location, RnaPval)
RNA_PSMF1$Location=as.integer(RNA_PSMF1$Location)
Ribo_PSMF1=read.table("../data/LocusZoom/Ribo.PSMF1.nomTotal.txt", stringsAsFactors = F, col.names = c("PeakID", "SID", "Dist", "RiboPval","slope")) %>% separate(SID, into=c("Chrom", "Location"), sep=":")%>% select( Location, RiboPval)
Ribo_PSMF1$Location=as.integer(Ribo_PSMF1$Location)

LD_structure_PSMF1=read.table("../data/LocusZoom/PSMF1_leadsnp.txt.ld", header=T) %>% select(BP_B, R2)
colnames(LD_structure_PSMF1)=c("Location", "R2")


allPheno_PSMF1=APA_Total_PSMF1 %>% inner_join(APA_Nuclear_PSMF1, by="Location") %>% inner_join(Prot_PSMF1, by="Location") %>% inner_join(Ribo_PSMF1, by="Location") %>% inner_join(RNA_PSMF1, by="Location") %>%  inner_join(LD_structure_PSMF1, by="Location") %>% filter(Location> 1121308 & Location < 1181308)
allPheno_PSMF1_melt=melt(allPheno_PSMF1, id.vars=c("Location", "R2"))


lockedscale_PSMF1=ggplot(allPheno_PSMF1_melt, aes(x=Location, y=-log10(value),col=R2)) +  geom_point() + facet_grid( rows=vars(variable)) + geom_vline(xintercept=1131308, linetype="dashed", color = "red") +  theme_linedraw()


freescale_PSMF1=ggplot(allPheno_PSMF1_melt, aes(x=Location, y=-log10(value), col=R2)) +  geom_point() + facet_grid( rows=vars(variable), scales = "free") + geom_vline(xintercept=1131308, linetype="dashed", color = "red") +  theme_linedraw()


plot_grid(lockedscale_PSMF1,freescale_PSMF1, align = "v", ncol=1)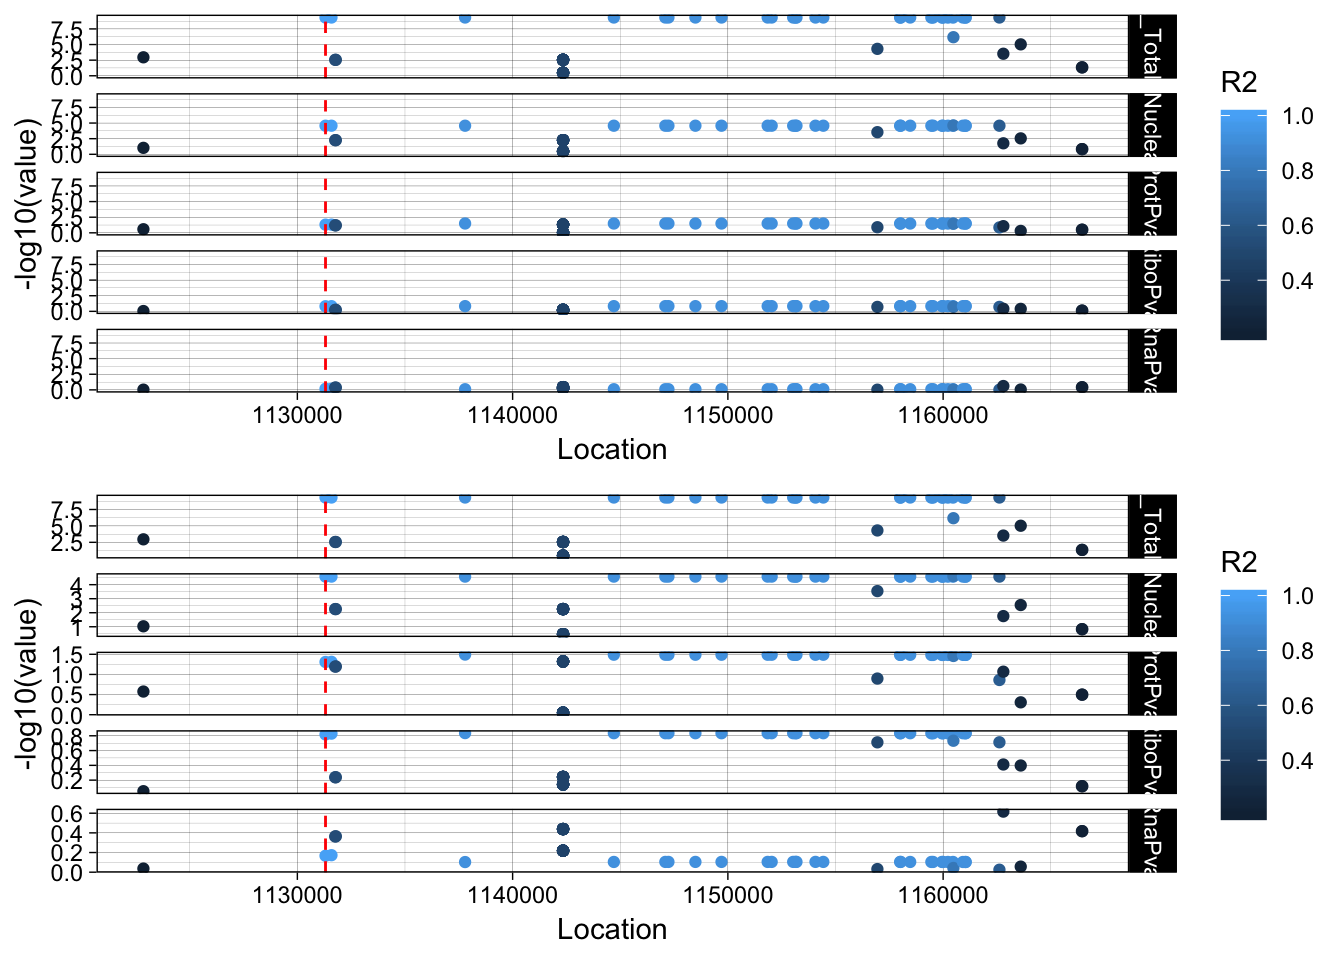
| Version | Author | Date |
|---|---|---|
| b2b7368 | Briana Mittleman | 2018-11-16 |
This varriant is in an intron of the PSMF1 gene. rs56398212
EBI3
This is a total and a nuclear QTL peak152751, ENSG00000105246 19:4236475
RunLocusZoom_EBI3.sh
#!/bin/bash

#SBATCH --job-name=RunLocusZoom_EBI3
#SBATCH --account=pi-yangili1
#SBATCH --time=36:00:00
#SBATCH --output=RunLocusZoom_EBI3.out
#SBATCH --error=RunLocusZoom_EBI3.err
#SBATCH --partition=broadwl
#SBATCH --mem=30G
#SBATCH --mail-type=END

module load plink


grep peak152751  /project2/gilad/briana/threeprimeseq/data/nominal_APAqtl_trans/filtered_APApeaks_merged_allchrom_refseqGenes_pheno_Nuclear_NomRes.txt > /project2/gilad/briana/threeprimeseq/data/LocusZoom/NuclearAPA.peak152751.EBI3.nomNuc.txt

grep peak152751  /project2/gilad/briana/threeprimeseq/data/nominal_APAqtl_trans/filtered_APApeaks_merged_allchrom_refseqGenes_pheno_Total_NomRes.txt > /project2/gilad/briana/threeprimeseq/data/LocusZoom/TotalAPA.peak152751.EBI3.nomTotal.txt

grep ENSG00000105246 /project2/gilad/briana/threeprimeseq/data/molecular_QTLs/nom/fastqtl_qqnorm_RNAseq_phase2.fixed.nominal.out > /project2/gilad/briana/threeprimeseq/data/LocusZoom/RNA.EBI3.nomTotal.txt

grep ENSG00000105246 /project2/gilad/briana/threeprimeseq/data/molecular_QTLs/nom/fastqtl_qqnorm_prot.fixed.nominal.out > /project2/gilad/briana/threeprimeseq/data/LocusZoom/Prot.EBI3.nomTotal.txt

 grep ENSG00000105246 /project2/gilad/briana/threeprimeseq/data/molecular_QTLs/nom/fastqtl_qqnorm_ribo_phase2.fixed.nominal.out > /project2/gilad/briana/threeprimeseq/data/LocusZoom/Ribo.EBI3.nomTotal.txt


plink --ped /project2/gilad/briana/YRI_geno_hg19/plinkYRIgeno_chr19.ped  --map /project2/gilad/briana/YRI_geno_hg19/plinkYRIgeno_chr19.map --r2  --ld-snp 19:4236475 --ld-window-kb 1000 --ld-window 99999  --out /project2/gilad/briana/threeprimeseq/data/LocusZoom/EBI3_leadsnp.txt
Move to comp
APA_Total_EBI3=read.table("../data/LocusZoom/TotalAPA.peak152751.EBI3.nomTotal.txt", stringsAsFactors = F, col.names = c("PeakID", "SID", "Dist", "APA_TotalPval","slope")) %>% separate(SID, into=c("Chrom", "Location"), sep=":") %>% select( Location, APA_TotalPval)
APA_Total_EBI3$Location=as.integer(APA_Total_EBI3$Location)

APA_Nuclear_EBI3=read.table("../data/LocusZoom/NuclearAPA.peak152751.EBI3.nomNuc.txt", stringsAsFactors = F, col.names = c("PeakID", "SID", "Dist", "APA_NuclearPval","slope")) %>% separate(SID, into=c("Chrom", "Location"), sep=":") %>% select( Location, APA_NuclearPval)
APA_Nuclear_EBI3$Location=as.integer(APA_Nuclear_EBI3$Location)

Prot_EBI3=read.table("../data/LocusZoom/Prot.EBI3.nomTotal.txt", stringsAsFactors = F, col.names = c("PeakID", "SID", "Dist", "ProtPval","slope")) %>% separate(SID, into=c("Chrom", "Location"), sep=":")%>% select( Location, ProtPval)
Prot_EBI3$Location=as.integer(Prot_EBI3$Location)
RNA_EBI3=read.table("../data/LocusZoom/RNA.EBI3.nomTotal.txt", stringsAsFactors = F, col.names = c("PeakID", "SID", "Dist", "RnaPval","slope")) %>% separate(SID, into=c("Chrom", "Location"), sep=":")%>% select( Location, RnaPval)
RNA_EBI3$Location=as.integer(RNA_EBI3$Location)
Ribo_EBI3=read.table("../data/LocusZoom/Ribo.EBI3.nomTotal.txt", stringsAsFactors = F, col.names = c("PeakID", "SID", "Dist", "RiboPval","slope")) %>% separate(SID, into=c("Chrom", "Location"), sep=":")%>% select( Location, RiboPval)
Ribo_EBI3$Location=as.integer(Ribo_EBI3$Location)

LD_structure_EBI3=read.table("../data/LocusZoom/EBI3_leadsnp.txt.ld", header=T) %>% select(BP_B, R2)
colnames(LD_structure_EBI3)=c("Location", "R2")


allPheno_EBI3=APA_Total_EBI3 %>% inner_join(APA_Nuclear_EBI3, by="Location") %>% inner_join(Prot_EBI3, by="Location") %>% inner_join(Ribo_EBI3, by="Location") %>% inner_join(RNA_EBI3, by="Location") %>%  inner_join(LD_structure_EBI3, by="Location") %>% filter(Location> 4231475 & Location < 4241475)
allPheno_EBI3_melt=melt(allPheno_EBI3, id.vars=c("Location", "R2"))


lockedscale_EBI3=ggplot(allPheno_EBI3_melt, aes(x=Location, y=-log10(value),col=R2)) +  geom_point() + facet_grid( rows=vars(variable)) + geom_vline(xintercept=4236475, linetype="dashed", color = "red") +  theme_linedraw()


freescale_EBI3=ggplot(allPheno_EBI3_melt, aes(x=Location, y=-log10(value), col=R2)) +  geom_point() + facet_grid( rows=vars(variable), scales = "free") + geom_vline(xintercept=4236475, linetype="dashed", color = "red") +  theme_linedraw()


plot_grid(lockedscale_EBI3,freescale_EBI3, align = "v", ncol=1)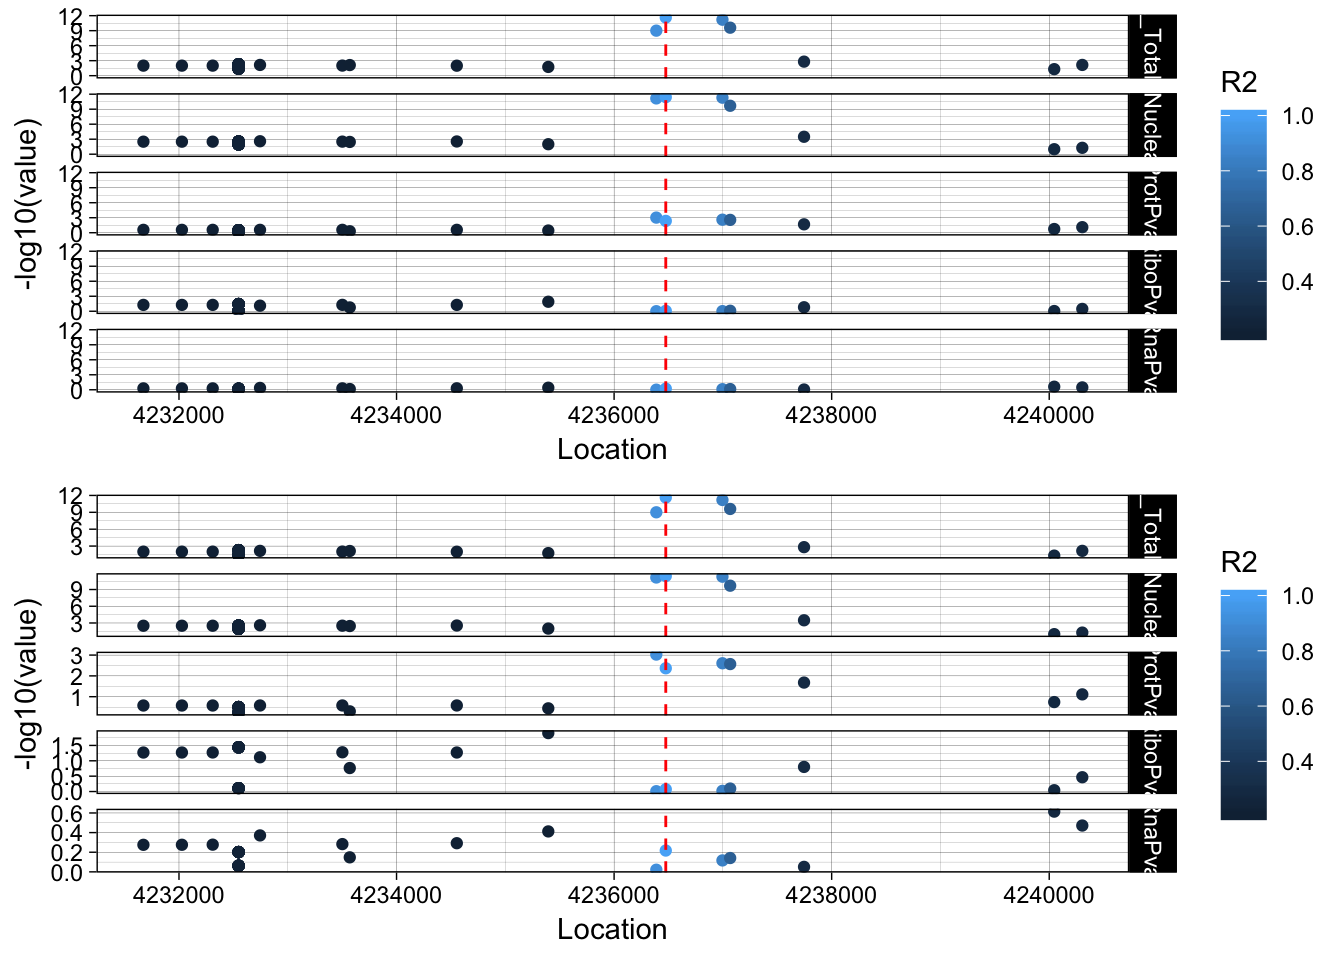
| Version | Author | Date |
|---|---|---|
| b2b7368 | Briana Mittleman | 2018-11-16 |
Snp is in the last intron of EBI3. It looks like the lead protien snp is the one directly upstream. rs353704. The region is CCCCAC. The preceeding SNP is rs353705. The relevent peak is 19:4236433:4236517. The snp is in the peak. This is interesting because the alternative allele decreases usage of this peak and the protein.
SACM1L
There are 3 QTLs in the total and nuclear for this. I am gonig to focus on the hit that has the same snp peak assocaition.
peak216086 3:45780980 ENSG00000211456
RunLocusZoom_SACM1L.sh
#!/bin/bash

#SBATCH --job-name=RunLocusZoom_SACM1L
#SBATCH --account=pi-yangili1
#SBATCH --time=36:00:00
#SBATCH --output=RunLocusZoom_SACM1L.out
#SBATCH --error=RunLocusZoom_SACM1L.err
#SBATCH --partition=broadwl
#SBATCH --mem=30G
#SBATCH --mail-type=END

module load plink


grep peak216086  /project2/gilad/briana/threeprimeseq/data/nominal_APAqtl_trans/filtered_APApeaks_merged_allchrom_refseqGenes_pheno_Nuclear_NomRes.txt > /project2/gilad/briana/threeprimeseq/data/LocusZoom/NuclearAPA.peak216086.SACM1L.nomNuc.txt

grep peak216086  /project2/gilad/briana/threeprimeseq/data/nominal_APAqtl_trans/filtered_APApeaks_merged_allchrom_refseqGenes_pheno_Total_NomRes.txt > /project2/gilad/briana/threeprimeseq/data/LocusZoom/TotalAPA.peak216086.SACM1L.nomTotal.txt

grep ENSG00000211456 /project2/gilad/briana/threeprimeseq/data/molecular_QTLs/nom/fastqtl_qqnorm_RNAseq_phase2.fixed.nominal.out > /project2/gilad/briana/threeprimeseq/data/LocusZoom/RNA.SACM1L.nomTotal.txt

grep ENSG00000211456 /project2/gilad/briana/threeprimeseq/data/molecular_QTLs/nom/fastqtl_qqnorm_prot.fixed.nominal.out > /project2/gilad/briana/threeprimeseq/data/LocusZoom/Prot.SACM1L.nomTotal.txt

 grep ENSG00000211456 /project2/gilad/briana/threeprimeseq/data/molecular_QTLs/nom/fastqtl_qqnorm_ribo_phase2.fixed.nominal.out > /project2/gilad/briana/threeprimeseq/data/LocusZoom/Ribo.SACM1L.nomTotal.txt


plink --ped /project2/gilad/briana/YRI_geno_hg19/plinkYRIgeno_chr3.ped  --map /project2/gilad/briana/YRI_geno_hg19/plinkYRIgeno_chr3.map --r2  --ld-snp 3:45780980 --ld-window-kb 1000 --ld-window 99999  --out /project2/gilad/briana/threeprimeseq/data/LocusZoom/SACM1L_leadsnp.txt
.
Move to comp
APA_Total_SACM1L=read.table("../data/LocusZoom/TotalAPA.peak216086.SACM1L.nomTotal.txt", stringsAsFactors = F, col.names = c("PeakID", "SID", "Dist", "APA_TotalPval","slope")) %>% separate(SID, into=c("Chrom", "Location"), sep=":") %>% select( Location, APA_TotalPval)
APA_Total_SACM1L$Location=as.integer(APA_Total_SACM1L$Location)

APA_Nuclear_SACM1L=read.table("../data/LocusZoom/NuclearAPA.peak216086.SACM1L.nomNuc.txt", stringsAsFactors = F, col.names = c("PeakID", "SID", "Dist", "APA_NuclearPval","slope")) %>% separate(SID, into=c("Chrom", "Location"), sep=":") %>% select( Location, APA_NuclearPval)
APA_Nuclear_SACM1L$Location=as.integer(APA_Nuclear_SACM1L$Location)

Prot_SACM1L=read.table("../data/LocusZoom/Prot.SACM1L.nomTotal.txt", stringsAsFactors = F, col.names = c("PeakID", "SID", "Dist", "ProtPval","slope")) %>% separate(SID, into=c("Chrom", "Location"), sep=":")%>% select( Location, ProtPval)
Prot_SACM1L$Location=as.integer(Prot_SACM1L$Location)
RNA_SACM1L=read.table("../data/LocusZoom/RNA.SACM1L.nomTotal.txt", stringsAsFactors = F, col.names = c("PeakID", "SID", "Dist", "RnaPval","slope")) %>% separate(SID, into=c("Chrom", "Location"), sep=":")%>% select( Location, RnaPval)
RNA_SACM1L$Location=as.integer(RNA_SACM1L$Location)
Ribo_SACM1L=read.table("../data/LocusZoom/Ribo.SACM1L.nomTotal.txt", stringsAsFactors = F, col.names = c("PeakID", "SID", "Dist", "RiboPval","slope")) %>% separate(SID, into=c("Chrom", "Location"), sep=":")%>% select( Location, RiboPval)
Ribo_SACM1L$Location=as.integer(Ribo_SACM1L$Location)

LD_structure_SACM1L=read.table("../data/LocusZoom/SACM1L_leadsnp.txt.ld", header=T) %>% select(BP_B, R2)
colnames(LD_structure_SACM1L)=c("Location", "R2")


allPheno_SACM1L=APA_Total_SACM1L %>% inner_join(APA_Nuclear_SACM1L, by="Location") %>% inner_join(Prot_SACM1L, by="Location") %>% inner_join(Ribo_SACM1L, by="Location") %>% inner_join(RNA_SACM1L, by="Location") %>%  inner_join(LD_structure_SACM1L, by="Location") %>% filter(Location> 45770980 & Location < 45790980)
allPheno_SACM1L_melt=melt(allPheno_SACM1L, id.vars=c("Location", "R2"))


lockedscale_SACM1L=ggplot(allPheno_SACM1L_melt, aes(x=Location, y=-log10(value),col=R2)) +  geom_point() + facet_grid( rows=vars(variable)) + geom_vline(xintercept=45780980, linetype="dashed", color = "red") +  theme_linedraw()


freescale_SACM1L=ggplot(allPheno_SACM1L_melt, aes(x=Location, y=-log10(value), col=R2)) +  geom_point() + facet_grid( rows=vars(variable), scales = "free") + geom_vline(xintercept=45780980, linetype="dashed", color = "red") +  theme_linedraw()


plot_grid(lockedscale_SACM1L,freescale_SACM1L, align = "v", ncol=1)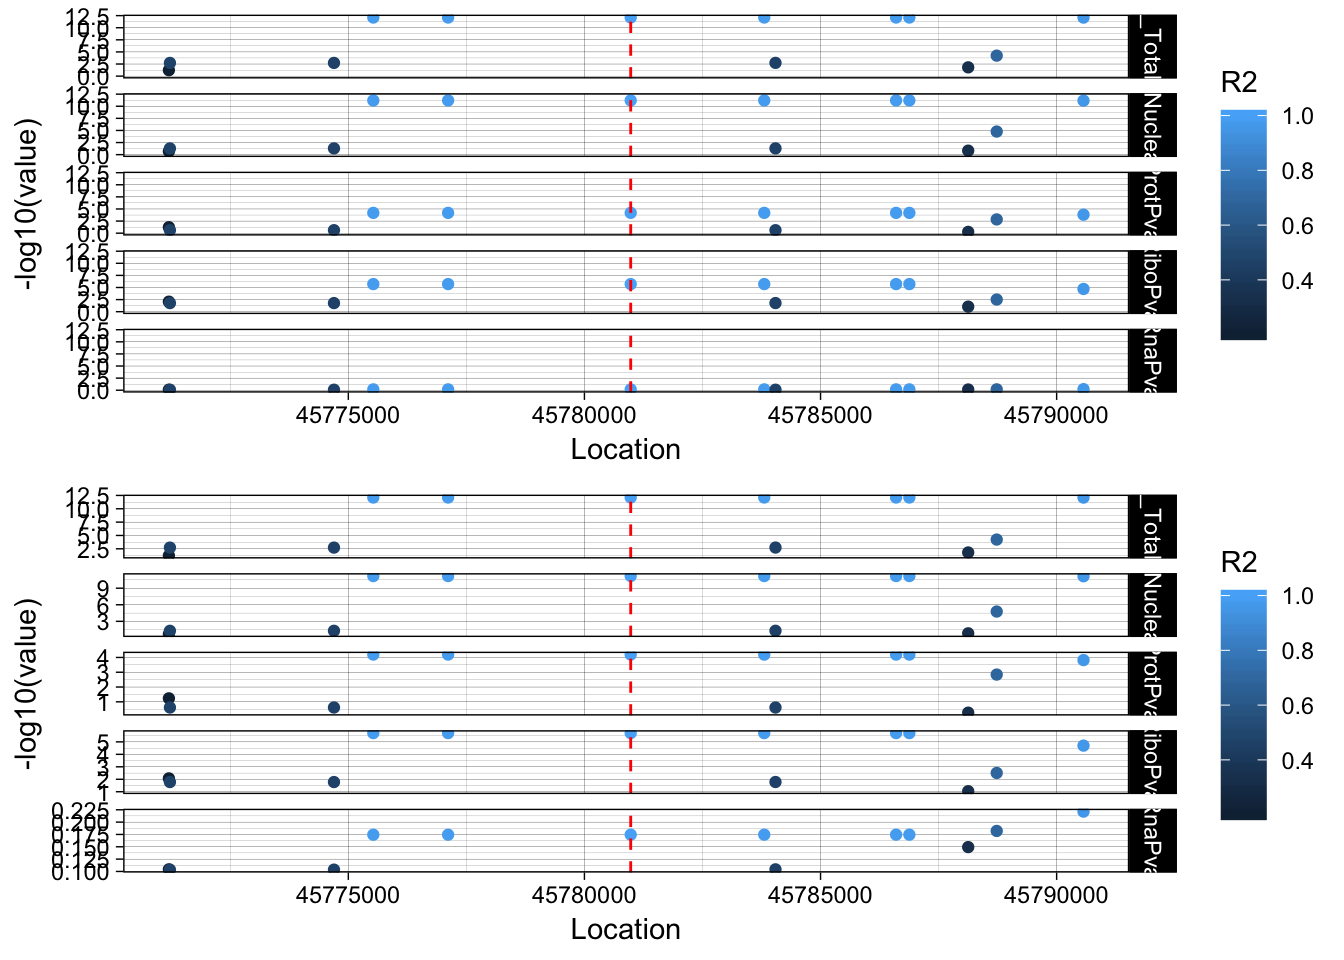
| Version | Author | Date |
|---|---|---|
| 410f25c | Briana Mittleman | 2018-11-16 |
The snp is in an intron of the SAMCL1 gene rs80065472. The peak is in the UTR of the gene.
LocusZoom online
APA_LZ=read.table("../data/LocusZoom/TotalAPA.peak228606.EIF2A.nomTotal.txt", stringsAsFactors = F, col.names = c("PeakID", "SNP", "Dist", "P","slope"))  %>% select( SNP, P)

write.table(APA_LZ,"../data/LocusZoom/apaEIF21LZ.txt", col.names = T, row.names = F, quote = F)
#sed -e 's/^/Chr/' apaEIF21LZ.txt > apaEIF21LZ_chr.txt

prot_LZ=read.table("../data/LocusZoom/Prot.EIF2A.nomTotal.txt", stringsAsFactors = F, col.names = c("PeakID", "SNP", "Dist", "P","slope"))  %>% select( SNP, P)

write.table(prot_LZ,"../data/LocusZoom/ProtEIF21LZ.txt", col.names = T, row.names = F, quote = F)

#sed -e 's/^/Chr/'ProtEIF21LZ.txt > ProtEIF21LZ_chr.txt


RNA_LZ=read.table("../data/LocusZoom/RNA.EIF2A.nomTotal.txt", stringsAsFactors = F, col.names = c("PeakID", "SNP", "Dist", "P","slope"))  %>% select( SNP, P)

write.table(RNA_LZ,"../data/LocusZoom/RNAEIF21LZ.txt", col.names = T, row.names = F, quote = F)

#sed -e 's/^/Chr/' RNAEIF21LZ.txt > RNAEIF21LZ_chr.txt


ribo_LZ=read.table("../data/LocusZoom/Ribo.EIF2A.nomTotal.txt", stringsAsFactors = F, col.names = c("PeakID", "SNP", "Dist", "P","slope"))  %>% select( SNP, P)

write.table(ribo_LZ,"../data/LocusZoom/RiboEIF21LZ.txt", col.names = T, row.names = F, quote = F)

#sed -e 's/^/Chr/' RiboEIF21LZ.txt > RiboEIF21LZ_chr.txt
Do this for another qtl:
APATotal_SACM1L_LZ=read.table("../data/LocusZoom/TotalAPA.peak216086.SACM1L.nomTotal.txt", stringsAsFactors = F, col.names = c("PeakID", "SNP", "Dist", "P","slope"))  %>% select( SNP, P)

write.table(APATotal_SACM1L_LZ,"../data/LocusZoom/apaTotalSACM1L_LZ.txt", col.names = T, row.names = F, quote = F)


APANuclear_SACM1L_LZ=read.table("../data/LocusZoom/NuclearAPA.peak216086.SACM1L.nomNuc.txt", stringsAsFactors = F, col.names = c("PeakID", "SNP", "Dist", "P","slope"))  %>% select( SNP, P)
write.table(APANuclear_SACM1L_LZ,"../data/LocusZoom/apaNuclearSACM1L_LZ.txt", col.names = T, row.names = F, quote = F)


prot_SACM1L_LZ=read.table("../data/LocusZoom/Prot.SACM1L.nomTotal.txt", stringsAsFactors = F, col.names = c("PeakID", "SNP", "Dist", "P","slope"))  %>% select( SNP, P)
write.table(prot_SACM1L_LZ,"../data/LocusZoom/ProtSACM1L_LZ.txt", col.names = T, row.names = F, quote = F)

#sed -e 's/^/Chr/'


RNA_SACM1L_LZ=read.table("../data/LocusZoom/RNA.SACM1L.nomTotal.txt", stringsAsFactors = F, col.names = c("PeakID", "SNP", "Dist", "P","slope"))  %>% select( SNP, P)

write.table(RNA_SACM1L_LZ,"../data/LocusZoom/RNASACM1L_LZ.txt", col.names = T, row.names = F, quote = F)

#sed -e 's/^/Chr/'


ribo_SACM1L_LZ=read.table("../data/LocusZoom/Ribo.SACM1L.nomTotal.txt", stringsAsFactors = F, col.names = c("PeakID", "SNP", "Dist", "P","slope"))  %>% select( SNP, P)

write.table(ribo_SACM1L_LZ,"../data/LocusZoom/RiboSACM1L_LZ.txt", col.names = T, row.names = F, quote = F)

#sed -e 's/^/Chr/'
One more example: LYAR
APATotal_LYAR_LZ=read.table("../data/LocusZoom/TotalAPA.peak303436.LYAR.nomTotal.txt", stringsAsFactors = F, col.names = c("PeakID", "SNP", "Dist", "P","slope"))  %>% select( SNP, P)

write.table(APATotal_LYAR_LZ,"../data/LocusZoom/apaTotalLYAR_LZ.txt", col.names = T, row.names = F, quote = F)


APANuclear_LYAR_LZ=read.table("../data/LocusZoom/NuclearAPA.peak303436.LYAR.nomNuc.txt", stringsAsFactors = F, col.names = c("PeakID", "SNP", "Dist", "P","slope"))  %>% select( SNP, P)
write.table(APANuclear_LYAR_LZ,"../data/LocusZoom/apaNuclearLYAR_LZ.txt", col.names = T, row.names = F, quote = F)


prot_LYAR_LZ=read.table("../data/LocusZoom/Prot.LYAR.nomTotal.txt", stringsAsFactors = F, col.names = c("PeakID", "SNP", "Dist", "P","slope"))  %>% select( SNP, P)
write.table(prot_LYAR_LZ,"../data/LocusZoom/ProtLYAR_LZ.txt", col.names = T, row.names = F, quote = F)

#sed -e 's/^/Chr/'


RNA_LYAR_LZ=read.table("../data/LocusZoom/RNA.LYAR.nomTotal.txt", stringsAsFactors = F, col.names = c("PeakID", "SNP", "Dist", "P","slope"))  %>% select( SNP, P)

write.table(RNA_LYAR_LZ,"../data/LocusZoom/RNALYAR_LZ.txt", col.names = T, row.names = F, quote = F)

#sed -e 's/^/Chr/'


ribo_LYAR_LZ=read.table("../data/LocusZoom/Ribo.LYAR.nomTotal.txt", stringsAsFactors = F, col.names = c("PeakID", "SNP", "Dist", "P","slope"))  %>% select( SNP, P)

write.table(ribo_LYAR_LZ,"../data/LocusZoom/RiboLYAR_LZ.txt", col.names = T, row.names = F, quote = F)

#sed -e 's/^/Chr/'
RINT1
APATotal_RINT1_LZ=read.table("../data/LocusZoom/TotalAPA.peak303436.RINT1.nomTotal.txt", stringsAsFactors = F, col.names = c("PeakID", "SNP", "Dist", "P","slope"))  %>% select( SNP, P)

write.table(APATotal_RINT1_LZ,"../data/LocusZoom/apaTotalRINT1_LZ.txt", col.names = T, row.names = F, quote = F)


APANuclear_RINT1_LZ=read.table("../data/LocusZoom/TotalAPA.peak303436.RINT1.nomNuc.txt", stringsAsFactors = F, col.names = c("PeakID", "SNP", "Dist", "P","slope"))  %>% select( SNP, P)
write.table(APANuclear_RINT1_LZ,"../data/LocusZoom/apaNuclearRINT1_LZ.txt", col.names = T, row.names = F, quote = F)


prot_RINT1_LZ=read.table("../data/LocusZoom/Prot.RINT1.nomTotal.txt", stringsAsFactors = F, col.names = c("PeakID", "SNP", "Dist", "P","slope"))  %>% select( SNP, P)
write.table(prot_RINT1_LZ,"../data/LocusZoom/ProtRINT1_LZ.txt", col.names = T, row.names = F, quote = F)

#sed -e 's/^/Chr/'


RNA_RINT1_LZ=read.table("../data/LocusZoom/RNA.RINT1.nomTotal.txt", stringsAsFactors = F, col.names = c("PeakID", "SNP", "Dist", "P","slope"))  %>% select( SNP, P)

write.table(RNA_RINT1_LZ,"../data/LocusZoom/RNARINT1_LZ.txt", col.names = T, row.names = F, quote = F)

#sed -e 's/^/Chr/'


ribo_RINT1_LZ=read.table("../data/LocusZoom/Ribo.RINT1.nomTotal.txt", stringsAsFactors = F, col.names = c("PeakID", "SNP", "Dist", "P","slope"))  %>% select( SNP, P)

write.table(ribo_RINT1_LZ,"../data/LocusZoom/RiboRINT1_LZ.txt", col.names = T, row.names = F, quote = F)

#sed -e 's/^/Chr/'
EBI3 rs353704.
APATotal_EBI3_LZ=read.table("../data/LocusZoom/TotalAPA.peak152751.EBI3.nomTotal.txt", stringsAsFactors = F, col.names = c("PeakID", "SNP", "Dist", "P","slope"))  %>% select( SNP, P)

write.table(APATotal_EBI3_LZ,"../data/LocusZoom/apaTotalEBI3_LZ.txt", col.names = T, row.names = F, quote = F)


APANuclear_EBI3_LZ=read.table("../data/LocusZoom/NuclearAPA.peak152751.EBI3.nomNuc.txt", stringsAsFactors = F, col.names = c("PeakID", "SNP", "Dist", "P","slope"))  %>% select( SNP, P)
write.table(APANuclear_EBI3_LZ,"../data/LocusZoom/apaNuclearEBI3_LZ.txt", col.names = T, row.names = F, quote = F)


prot_EBI3_LZ=read.table("../data/LocusZoom/Prot.EBI3.nomTotal.txt", stringsAsFactors = F, col.names = c("PeakID", "SNP", "Dist", "P","slope"))  %>% select( SNP, P)
write.table(prot_EBI3_LZ,"../data/LocusZoom/ProtEBI3_LZ.txt", col.names = T, row.names = F, quote = F)

#sed -e 's/^/Chr/'


RNA_EBI3_LZ=read.table("../data/LocusZoom/RNA.EBI3.nomTotal.txt", stringsAsFactors = F, col.names = c("PeakID", "SNP", "Dist", "P","slope"))  %>% select( SNP, P)

write.table(RNA_EBI3_LZ,"../data/LocusZoom/RNAEBI3_LZ.txt", col.names = T, row.names = F, quote = F)

#sed -e 's/^/Chr/'


ribo_EBI3_LZ=read.table("../data/LocusZoom/Ribo.EBI3.nomTotal.txt", stringsAsFactors = F, col.names = c("PeakID", "SNP", "Dist", "P","slope"))  %>% select( SNP, P)

write.table(ribo_EBI3_LZ,"../data/LocusZoom/RiboEBI3_LZ.txt", col.names = T, row.names = F, quote = F)

#sed -e 's/^/Chr/'
Few more examples:
APBB1IP peak35280 10:26732342
go with rs71401891 this snp is 10:26732343
grep APBB1IP /project2/gilad/briana/genome_anotation_data/ensemble_to_genename.txt
ENSG00000077420
ENSG00000077420

grep peak35280  /project2/gilad/briana/threeprimeseq/data/nominal_APAqtl_trans/filtered_APApeaks_merged_allchrom_refseqGenes_pheno_Nuclear_NomRes.txt > /project2/gilad/briana/threeprimeseq/data/LocusZoom/NuclearAPA.peak35280.APBB1IP.nomNuc.txt

grep peak35280  /project2/gilad/briana/threeprimeseq/data/nominal_APAqtl_trans/filtered_APApeaks_merged_allchrom_refseqGenes_pheno_Total_NomRes.txt > /project2/gilad/briana/threeprimeseq/data/LocusZoom/TotalAPA.peak35280.APBB1IP.nomTotal.txt

grep ENSG00000077420 /project2/gilad/briana/threeprimeseq/data/molecular_QTLs/nom/fastqtl_qqnorm_RNAseq_phase2.fixed.nominal.out > /project2/gilad/briana/threeprimeseq/data/LocusZoom/RNA.APBB1IP.nomTotal.txt

grep ENSG00000077420 /project2/gilad/briana/threeprimeseq/data/molecular_QTLs/nom/fastqtl_qqnorm_prot.fixed.nominal.out > /project2/gilad/briana/threeprimeseq/data/LocusZoom/Prot.APBB1IP.nomTotal.txt

 grep ENSG00000077420 /project2/gilad/briana/threeprimeseq/data/molecular_QTLs/nom/fastqtl_qqnorm_ribo_phase2.fixed.nominal.out > /project2/gilad/briana/threeprimeseq/data/LocusZoom/Ribo.APBB1IP.nomTotal.txt
APATotal_APBB1IP_LZ=read.table("../data/LocusZoom/TotalAPA.peak35280.APBB1IP.nomTotal.txt", stringsAsFactors = F, col.names = c("PeakID", "SNP", "Dist", "P","slope")) %>% select( SNP, P)
write.table(APATotal_APBB1IP_LZ,"../data/LocusZoom/apaTotalAPBB1IP_LZ.txt", col.names = T, row.names = F, quote = F)
APANuclear_APBB1IP_LZ=read.table("../data/LocusZoom/NuclearAPA.peak35280.APBB1IP.nomNuc.txt", stringsAsFactors = F, col.names = c("PeakID", "SNP", "Dist", "P","slope")) %>% select( SNP, P)
write.table(APANuclear_APBB1IP_LZ,"../data/LocusZoom/apaNuclearAPBB1IP_LZ.txt", col.names = T, row.names = F, quote = F)
prot_APBB1IP_LZ=read.table("../data/LocusZoom/Prot.APBB1IP.nomTotal.txt", stringsAsFactors = F, col.names = c("PeakID", "SNP", "Dist", "P","slope")) %>% select( SNP, P)
write.table(prot_APBB1IP_LZ,"../data/LocusZoom/ProtAPBB1IP_LZ.txt", col.names = T, row.names = F, quote = F)
#sed -e 's/^/Chr/'
RNA_APBB1IP_LZ=read.table("../data/LocusZoom/RNA.APBB1IP.nomTotal.txt", stringsAsFactors = F, col.names = c("PeakID", "SNP", "Dist", "P","slope")) %>% select( SNP, P)
write.table(RNA_APBB1IP_LZ,"../data/LocusZoom/RNAAPBB1IP_LZ.txt", col.names = T, row.names = F, quote = F)
#sed -e 's/^/Chr/'
ribo_APBB1IP_LZ=read.table("../data/LocusZoom/Ribo.APBB1IP.nomTotal.txt", stringsAsFactors = F, col.names = c("PeakID", "SNP", "Dist", "P","slope")) %>% select( SNP, P)
write.table(ribo_APBB1IP_LZ,"../data/LocusZoom/RiboAPBB1IP_LZ.txt", col.names = T, row.names = F, quote = F)
#sed -e 's/^/Chr/' There is no usable LD inforamtion for this snp in the LocusZoom database
PTER
rs7075357 PTER nuclear (3’ UTR varriant) peak34317
grep PTER /project2/gilad/briana/genome_anotation_data/ensemble_to_genename.txt
ENSG00000165983


grep peak34317  /project2/gilad/briana/threeprimeseq/data/nominal_APAqtl_trans/filtered_APApeaks_merged_allchrom_refseqGenes_pheno_Nuclear_NomRes.txt > /project2/gilad/briana/threeprimeseq/data/LocusZoom/NuclearAPA.peak34317.PTER.nomNuc.txt

grep peak34317  /project2/gilad/briana/threeprimeseq/data/nominal_APAqtl_trans/filtered_APApeaks_merged_allchrom_refseqGenes_pheno_Total_NomRes.txt > /project2/gilad/briana/threeprimeseq/data/LocusZoom/TotalAPA.peak34317.PTER.nomTotal.txt

grep ENSG00000165983 /project2/gilad/briana/threeprimeseq/data/molecular_QTLs/nom/fastqtl_qqnorm_RNAseq_phase2.fixed.nominal.out > /project2/gilad/briana/threeprimeseq/data/LocusZoom/RNA.PTER.nomTotal.txt

grep ENSG00000165983 /project2/gilad/briana/threeprimeseq/data/molecular_QTLs/nom/fastqtl_qqnorm_prot.fixed.nominal.out > /project2/gilad/briana/threeprimeseq/data/LocusZoom/Prot.PTER.nomTotal.txt

 grep ENSG00000165983 /project2/gilad/briana/threeprimeseq/data/molecular_QTLs/nom/fastqtl_qqnorm_ribo_phase2.fixed.nominal.out > /project2/gilad/briana/threeprimeseq/data/LocusZoom/Ribo.PTER.nomTotal.txt
APATotal_PTER_LZ=read.table("../data/LocusZoom/TotalAPA.peak34317.PTER.nomTotal.txt", stringsAsFactors = F, col.names = c("PeakID", "SNP", "Dist", "P","slope")) %>% select( SNP, P)
write.table(APATotal_PTER_LZ,"../data/LocusZoom/apaTotalPTER_LZ.txt", col.names = T, row.names = F, quote = F)
APANuclear_PTER_LZ=read.table("../data/LocusZoom/NuclearAPA.peak34317.PTER.nomNuc.txt", stringsAsFactors = F, col.names = c("PeakID", "SNP", "Dist", "P","slope")) %>% select( SNP, P)
write.table(APANuclear_PTER_LZ,"../data/LocusZoom/apaNuclearPTER_LZ.txt", col.names = T, row.names = F, quote = F)
prot_PTER_LZ=read.table("../data/LocusZoom/Prot.PTER.nomTotal.txt", stringsAsFactors = F, col.names = c("PeakID", "SNP", "Dist", "P","slope")) %>% select( SNP, P)
write.table(prot_PTER_LZ,"../data/LocusZoom/ProtPTER_LZ.txt", col.names = T, row.names = F, quote = F)
#sed -e 's/^/Chr/'
RNA_PTER_LZ=read.table("../data/LocusZoom/RNA.PTER.nomTotal.txt", stringsAsFactors = F, col.names = c("PeakID", "SNP", "Dist", "P","slope")) %>% select( SNP, P)
write.table(RNA_PTER_LZ,"../data/LocusZoom/RNAPTER_LZ.txt", col.names = T, row.names = F, quote = F)
#sed -e 's/^/Chr/'
ribo_PTER_LZ=read.table("../data/LocusZoom/Ribo.PTER.nomTotal.txt", stringsAsFactors = F, col.names = c("PeakID", "SNP", "Dist", "P","slope")) %>% select( SNP, P)
write.table(ribo_PTER_LZ,"../data/LocusZoom/RiboPTER_LZ.txt", col.names = T, row.names = F, quote = F)
#sed -e 's/^/Chr/'
sessionInfo()R version 3.5.1 (2018-07-02)
Platform: x86_64-apple-darwin15.6.0 (64-bit)
Running under: macOS 10.14.1
Matrix products: default
BLAS: /Library/Frameworks/R.framework/Versions/3.5/Resources/lib/libRblas.0.dylib
LAPACK: /Library/Frameworks/R.framework/Versions/3.5/Resources/lib/libRlapack.dylib
locale:
[1] en_US.UTF-8/en_US.UTF-8/en_US.UTF-8/C/en_US.UTF-8/en_US.UTF-8
attached base packages:
[1] grid stats graphics grDevices utils datasets methods
[8] base
other attached packages:
[1] bindrcpp_0.2.2 cowplot_0.9.3 ggpubr_0.1.8
[4] magrittr_1.5 data.table_1.11.8 VennDiagram_1.6.20
[7] futile.logger_1.4.3 forcats_0.3.0 stringr_1.4.0
[10] dplyr_0.7.6 purrr_0.2.5 readr_1.1.1
[13] tidyr_0.8.1 tibble_1.4.2 ggplot2_3.0.0
[16] tidyverse_1.2.1 reshape2_1.4.3 workflowr_1.2.0
loaded via a namespace (and not attached):
[1] tidyselect_0.2.4 haven_1.1.2 lattice_0.20-35
[4] colorspace_1.3-2 htmltools_0.3.6 yaml_2.2.0
[7] rlang_0.2.2 pillar_1.3.0 glue_1.3.0
[10] withr_2.1.2 modelr_0.1.2 lambda.r_1.2.3
[13] readxl_1.1.0 bindr_0.1.1 plyr_1.8.4
[16] munsell_0.5.0 gtable_0.2.0 cellranger_1.1.0
[19] rvest_0.3.2 evaluate_0.13 labeling_0.3
[22] knitr_1.20 broom_0.5.0 Rcpp_0.12.19
[25] formatR_1.5 scales_1.0.0 backports_1.1.2
[28] jsonlite_1.6 fs_1.2.6 hms_0.4.2
[31] digest_0.6.17 stringi_1.2.4 rprojroot_1.3-2
[34] cli_1.0.1 tools_3.5.1 lazyeval_0.2.1
[37] futile.options_1.0.1 crayon_1.3.4 whisker_0.3-2
[40] pkgconfig_2.0.2 xml2_1.2.0 lubridate_1.7.4
[43] assertthat_0.2.0 rmarkdown_1.11 httr_1.3.1
[46] rstudioapi_0.9.0 R6_2.3.0 nlme_3.1-137
[49] git2r_0.24.0 compiler_3.5.1