Top APA QTL in other phenotypes
Briana Mittleman
10/8/2018
Last updated: 2018-10-11
workflowr checks: (Click a bullet for more information)-
✔ R Markdown file: up-to-date
Great! Since the R Markdown file has been committed to the Git repository, you know the exact version of the code that produced these results.
-
✔ Environment: empty
Great job! The global environment was empty. Objects defined in the global environment can affect the analysis in your R Markdown file in unknown ways. For reproduciblity it’s best to always run the code in an empty environment.
-
✔ Seed:
set.seed(12345)The command
set.seed(12345)was run prior to running the code in the R Markdown file. Setting a seed ensures that any results that rely on randomness, e.g. subsampling or permutations, are reproducible. -
✔ Session information: recorded
Great job! Recording the operating system, R version, and package versions is critical for reproducibility.
-
Great! You are using Git for version control. Tracking code development and connecting the code version to the results is critical for reproducibility. The version displayed above was the version of the Git repository at the time these results were generated.✔ Repository version: 1d97af5
Note that you need to be careful to ensure that all relevant files for the analysis have been committed to Git prior to generating the results (you can usewflow_publishorwflow_git_commit). workflowr only checks the R Markdown file, but you know if there are other scripts or data files that it depends on. Below is the status of the Git repository when the results were generated:
Note that any generated files, e.g. HTML, png, CSS, etc., are not included in this status report because it is ok for generated content to have uncommitted changes.Ignored files: Ignored: .DS_Store Ignored: .Rhistory Ignored: .Rproj.user/ Ignored: output/.DS_Store Untracked files: Untracked: KalistoAbundance18486.txt Untracked: analysis/genometrack_figs.Rmd Untracked: analysis/ncbiRefSeq_sm.sort.mRNA.bed Untracked: analysis/snake.config.notes.Rmd Untracked: analysis/verifyBAM.Rmd Untracked: data/18486.genecov.txt Untracked: data/APApeaksYL.total.inbrain.bed Untracked: data/NuclearApaQTLs.txt Untracked: data/RNAkalisto/ Untracked: data/TotalApaQTLs.txt Untracked: data/Totalpeaks_filtered_clean.bed Untracked: data/YL-SP-18486-T-combined-genecov.txt Untracked: data/YL-SP-18486-T_S9_R1_001-genecov.txt Untracked: data/apaExamp/ Untracked: data/bedgraph_peaks/ Untracked: data/bin200.5.T.nuccov.bed Untracked: data/bin200.Anuccov.bed Untracked: data/bin200.nuccov.bed Untracked: data/clean_peaks/ Untracked: data/comb_map_stats.csv Untracked: data/comb_map_stats.xlsx Untracked: data/comb_map_stats_39ind.csv Untracked: data/combined_reads_mapped_three_prime_seq.csv Untracked: data/ensemble_to_genename.txt Untracked: data/filtered_APApeaks_merged_allchrom_refseqTrans.closest2End.bed Untracked: data/filtered_APApeaks_merged_allchrom_refseqTrans.closest2End.noties.bed Untracked: data/first50lines_closest.txt Untracked: data/gencov.test.csv Untracked: data/gencov.test.txt Untracked: data/gencov_zero.test.csv Untracked: data/gencov_zero.test.txt Untracked: data/gene_cov/ Untracked: data/joined Untracked: data/leafcutter/ Untracked: data/merged_combined_YL-SP-threeprimeseq.bg Untracked: data/mol_overlap/ Untracked: data/nom_QTL/ Untracked: data/nom_QTL_opp/ Untracked: data/nom_QTL_trans/ Untracked: data/nuc6up/ Untracked: data/other_qtls/ Untracked: data/peakPerRefSeqGene/ Untracked: data/perm_QTL/ Untracked: data/perm_QTL_opp/ Untracked: data/perm_QTL_trans/ Untracked: data/reads_mapped_three_prime_seq.csv Untracked: data/smash.cov.results.bed Untracked: data/smash.cov.results.csv Untracked: data/smash.cov.results.txt Untracked: data/smash_testregion/ Untracked: data/ssFC200.cov.bed Untracked: data/temp.file1 Untracked: data/temp.file2 Untracked: data/temp.gencov.test.txt Untracked: data/temp.gencov_zero.test.txt Untracked: output/picard/ Untracked: output/plots/ Untracked: output/qual.fig2.pdf Unstaged changes: Modified: analysis/28ind.peak.explore.Rmd Modified: analysis/39indQC.Rmd Modified: analysis/PeakToGeneAssignment.Rmd Modified: analysis/cleanupdtseq.internalpriming.Rmd Modified: analysis/dif.iso.usage.leafcutter.Rmd Modified: analysis/diff_iso_pipeline.Rmd Modified: analysis/explore.filters.Rmd Modified: analysis/overlapMolQTL.Rmd Modified: analysis/overlap_qtls.Rmd Modified: analysis/peakOverlap_oppstrand.Rmd Modified: analysis/pheno.leaf.comb.Rmd Modified: analysis/test.max2.Rmd Modified: code/Snakefile
Expand here to see past versions:
| File | Version | Author | Date | Message |
|---|---|---|---|---|
| Rmd | 1d97af5 | Briana Mittleman | 2018-10-11 | add examples |
| html | 8211a07 | Briana Mittleman | 2018-10-11 | Build site. |
| Rmd | 9b23ee6 | Briana Mittleman | 2018-10-11 | add example plots |
| html | ad6a5bf | Briana Mittleman | 2018-10-11 | Build site. |
| Rmd | 373d351 | Briana Mittleman | 2018-10-11 | add pheno code- working |
| html | e73be70 | Briana Mittleman | 2018-10-09 | Build site. |
| Rmd | 2f5f071 | Briana Mittleman | 2018-10-09 | add pheno code- not working yet |
| html | b6d5c19 | Briana Mittleman | 2018-10-08 | Build site. |
| Rmd | cdec3c1 | Briana Mittleman | 2018-10-08 | change colors |
| html | 077ed60 | Briana Mittleman | 2018-10-08 | Build site. |
| Rmd | 50c8b76 | Briana Mittleman | 2018-10-08 | plots for EIF2A in mult phenos |
Upload Data:
Library
library(workflowr)This is workflowr version 1.1.1
Run ?workflowr for help getting startedlibrary(reshape2)
library(tidyverse)── Attaching packages ─────────────────────────────────────────────────────────────────────────────────────── tidyverse 1.2.1 ──✔ ggplot2 3.0.0 ✔ purrr 0.2.5
✔ tibble 1.4.2 ✔ dplyr 0.7.6
✔ tidyr 0.8.1 ✔ stringr 1.3.1
✔ readr 1.1.1 ✔ forcats 0.3.0── Conflicts ────────────────────────────────────────────────────────────────────────────────────────── tidyverse_conflicts() ──
✖ dplyr::filter() masks stats::filter()
✖ dplyr::lag() masks stats::lag()library(VennDiagram)Loading required package: gridLoading required package: futile.loggerlibrary(data.table)
Attaching package: 'data.table'The following objects are masked from 'package:dplyr':
between, first, lastThe following object is masked from 'package:purrr':
transposeThe following objects are masked from 'package:reshape2':
dcast, meltlibrary(cowplot)
Attaching package: 'cowplot'The following object is masked from 'package:ggplot2':
ggsavePermuted Results from APA:
nuclearAPA=read.table("../data/perm_QTL_trans/filtered_APApeaks_merged_allchrom_refseqGenes_pheno_Nuclear_transcript_permResBH.txt", stringsAsFactors = F, header = T)
totalAPA=read.table("../data/perm_QTL_trans/filtered_APApeaks_merged_allchrom_refseqGenes_pheno_Total_transcript_permResBH.txt", stringsAsFactors = F, header=T)
I want to use a buzz swarm plot to plot peak usage for some of the top QTLs. I can use the examples I gave Tony.
Nuclear:
* peak305794, sid: 7:128635754
- peak: 164036, sid: 2:3502035
Total:
Peak: peak228606, SID 3:150302010
Peak: peak152751, SID 19:4236475
I need to pull out the genotypes for each snp and the corresponding phenotype. I want to make a python script that I can give a snp and a peak and it will make a table with the genotypes and phenotypes for the necessary gene snp pair.
Example Peak: peak228606, SID 3:150302010
geno3_m=fread("../data/apaExamp/geno3_150302010.txt", header = T) %>% dplyr::select(starts_with("NA")) %>% t
geno3df= data.frame(geno3_m) %>% separate(geno3_m, into=c("geno", "dose", "extra"), sep=":") %>% dplyr::select(dose) %>% rownames_to_column(var="ind")
apaphen228606_m= fread("../data/apaExamp/Total.peak228606.txt", header = T) %>% dplyr::select(starts_with("NA")) %>% t
apaphen228606_df=data.frame(apaphen228606_m) %>% rownames_to_column(var="ind")
toplotAPA=geno3df %>% inner_join(apaphen228606_df, by="ind")
toplotAPA$dose= as.factor(toplotAPA$dose)
colnames(toplotAPA)= c("ind", "Genotype", "APA")
EIF2A_APAex=ggplot(toplotAPA, aes(y=APA, x=Genotype, by=Genotype, fill=Genotype)) + geom_boxplot() + geom_jitter() + labs(y="APA phenotype", title="Total APA: Peak 228606, EIF2A") + scale_fill_brewer(palette="YlOrRd")
ggsave("../output/plots/EIF2a_APA.png", EIF2A_APAex)Saving 7 x 5 in imageThis is in the gene EIF2A, I need to find this in the eQTL data. The ensg id for this gene is ENSG00000144895.
RNAseqEIF2A_m=read.table("../data/apaExamp/RNAseq.phenoEIF2A.txt", header=T) %>% dplyr::select(starts_with("NA")) %>% t
RNAseqEIF2A_df= data.frame(RNAseqEIF2A_m) %>% rownames_to_column("ind")

plotRNA=geno3df %>% inner_join(RNAseqEIF2A_df, by="ind")
plotRNA$dose= as.factor(plotRNA$dose)
colnames(plotRNA)= c("ind", "Genotype", "Expression")

EIF2A_RNAex=ggplot(plotRNA, aes(y=Expression, x=Genotype, by=Genotype, fill=Genotype)) + geom_boxplot() + geom_jitter() + labs(y="Normalized Expression", title="Gene Expression: EIF2A") + scale_fill_brewer(palette="YlGn")

ggsave("../output/plots/EIF2a_RNA.png", EIF2A_RNAex)
Saving 7 x 5 in imageTry this in protein:
ProtEIF2A_m=read.table("../data/apaExamp/ProtEIF2A.txt", header=T) %>% dplyr::select(starts_with("NA")) %>% t
ProtEIF2A_df= data.frame(ProtEIF2A_m) %>% rownames_to_column("ind")

plotProt=geno3df %>% inner_join(ProtEIF2A_df, by="ind")
plotProt$dose= as.factor(plotProt$dose)
colnames(plotProt)= c("ind", "Genotype", "Prot_level")

IF2A_Protex= ggplot(plotProt, aes(y=Prot_level, x=Genotype, by=Genotype, fill=Genotype)) + geom_boxplot() + geom_jitter() + labs(y="Normalized Protein Level", title="Protein Level: EIF2A") +scale_fill_brewer(palette="PuBu")

ggsave("../output/plots/EIF2a_Prot.png", IF2A_Protex)
Saving 7 x 5 in imagemultphenoEIF2a=plot_grid(EIF2A_APAex,IF2A_Protex,EIF2A_RNAex,nrow=1)
ggsave("../output/plots/EIF2a_multpheno.png", multphenoEIF2a, width=15, height=5)Do this with 4su 60:
have to remove the #
su60_EIF2A_m=read.table("../data/apaExamp/Foursu60EIF2A.txt", header=T) %>% dplyr::select(starts_with("NA")) %>% t
su60_EIF2A_df= data.frame(su60_EIF2A_m) %>% rownames_to_column("ind")

plot4su60=geno3df %>% inner_join(su60_EIF2A_df, by="ind")
plot4su60$dose= as.factor(plot4su60$dose)
colnames(plot4su60)= c("ind", "Genotype", "su60")

EIF2A_4su60ex=ggplot(plot4su60, aes(y=su60, x=Genotype, by=Genotype, fill=Genotype)) + geom_boxplot() + geom_jitter() + labs(y="4su60", title="4su 60min Value: EIF2A") + scale_fill_brewer(palette="RdPu") +  theme_classic()

ggsave("../output/plots/EIF2a_4su60.png", EIF2A_4su60ex)
Saving 7 x 5 in imageGeuvadis RNA
rnaG_EIF2A_m=read.table("../data/apaExamp/RNA_GEU_EIF2A.txt", header=T) %>% dplyr::select(starts_with("NA")) %>% t
rnaG_EIF2A_df= data.frame(rnaG_EIF2A_m) %>% rownames_to_column("ind")

plotRNAg=geno3df %>% inner_join(rnaG_EIF2A_df, by="ind")
plotRNAg$dose= as.factor(plotRNAg$dose)
colnames(plotRNAg)= c("ind", "Genotype", "RNAg")

EIF2A_RNAgex=ggplot(plotRNAg, aes(y=RNAg, x=Genotype, by=Genotype, fill=Genotype)) + geom_boxplot() + geom_jitter() + labs(y="RNA expression", title="RNA Expression Geuvadis: EIF2A") + scale_fill_brewer(palette="RdPu")

ggsave("../output/plots/EIF2a_RNAg.png", EIF2A_RNAgex)
Saving 7 x 5 in imageRibo:
ribo_EIF2A_m=read.table("../data/apaExamp/Ribo_EIF2A.txt", header=T) %>% dplyr::select(starts_with("NA")) %>% t
ribo_EIF2A_df= data.frame(ribo_EIF2A_m) %>% rownames_to_column("ind")

plotrib=geno3df %>% inner_join(ribo_EIF2A_df, by="ind")
plotrib$dose= as.factor(plotrib$dose)
colnames(plotrib)= c("ind", "Genotype", "Ribo")

EIF2A_riboex=ggplot(plotrib, aes(y=Ribo, x=Genotype, by=Genotype, fill=Genotype)) + geom_boxplot() + geom_jitter() + labs(y="RNA expression", title="Ribo Geuvadis: EIF2A") + scale_fill_brewer(palette="RdPu")

ggsave("../output/plots/EIF2a_Ribo.png", EIF2A_riboex)
Saving 7 x 5 in imageCreate a script to make the relevent files
Python script that take a chromosome, snp, peak#, fraction
createQTLsnpAPAPhenTable.py
def main(PhenFile, GenFile, outFile, snp, peak):
    fout=open(outFile, "w")
    #Phen=open(PhenFile, "r")
    Gen=open(GenFile, "r")
    #get ind and pheno info
    def get_pheno():
      Phen=open(PhenFile, "r")
      for num, ln in enumerate(Phen):
          if num == 0:
              indiv= ln.split()[4:]
          else:
              id=ln.split()[3].split(":")[3]
              peakID=id.split("_")[2]
              if peakID == peak:
                  pheno_list=ln.split()[4:]
                  pheno_data=list(zip(indiv,pheno_list))
                  print(pheno_data)
                  return(pheno_data)
    def get_geno():
      for num, lnG in enumerate(Gen):
          if num == 13:
              Ind_geno=lnG.split()[9:]
          if num >= 14:
              sid= lnG.split()[2]
              if sid == snp:
                  gen_list=lnG.split()[9:]
                  allele1=[]
                  allele2=[]
                  for i in gen_list:
                      genotype=i.split(":")[0]
                      allele1.append(genotype.split("|")[0])
                      allele2.append(genotype.split("|")[1])
            #now i have my indiv., phen, allele 1, alle 2
                  geno_data=list(zip(Ind_geno, allele1, allele2))
                  print(geno_data)
                  return(geno_data)

    phenotype=get_pheno()
    pheno_df=pd.DataFrame(data=phenotype,columns=["Ind", "Pheno"])
    genotype=get_geno()
    geno_df=pd.DataFrame(data=genotype, columns=["Ind", "Allele1", "Allele2"])
    full_df=pd.merge(geno_df, pheno_df, how="inner", on="Ind")
    full_df.to_csv(fout, sep="\t", encoding='utf-8', index=False)
    fout.close()


if __name__ == "__main__":
    import sys
    import pandas as pd
    chrom=sys.argv[1]
    snp = sys.argv[2]
    peak = sys.argv[3]
    fraction=sys.argv[4]

    PhenFile = "/project2/gilad/briana/threeprimeseq/data/phenotypes_filtPeakTranscript/filtered_APApeaks_merged_allchrom_refseqGenes.Transcript_sm_quant.%s.pheno_fixed.txt.gz.phen_chr%s"%(fraction, chrom)
    GenFile= "/project2/gilad/briana/YRI_geno_hg19/chr%s.dose.filt.vcf"%(chrom)
    outFile = "/project2/gilad/briana/threeprimeseq/data/ApaQTL_examples/qtlSNP_PeakAPA%s.%s%s.txt"%(fraction, snp, peak)
    main(PhenFile, GenFile, outFile, snp, peak)
Use the results to plot the nuclear pheno:
EIF2a_APAnuc=read.table("../data/apaExamp/qtlSNP_PeakAPANuclear.3:150302010peak228606.txt", header=T, stringsAsFactors = F) %>% mutate(Geno=Allele1 + Allele2)

EIF2a_APAnuc$Geno= as.factor(as.character(EIF2a_APAnuc$Geno))


ggplot(EIF2a_APAnuc, aes(y=Pheno, x=Geno, by=Geno, fill=Geno)) + geom_boxplot() + geom_jitter() + labs(y="APA Nuc Usage", title="APA nuc: EIF2A") + scale_fill_brewer(palette="RdPu")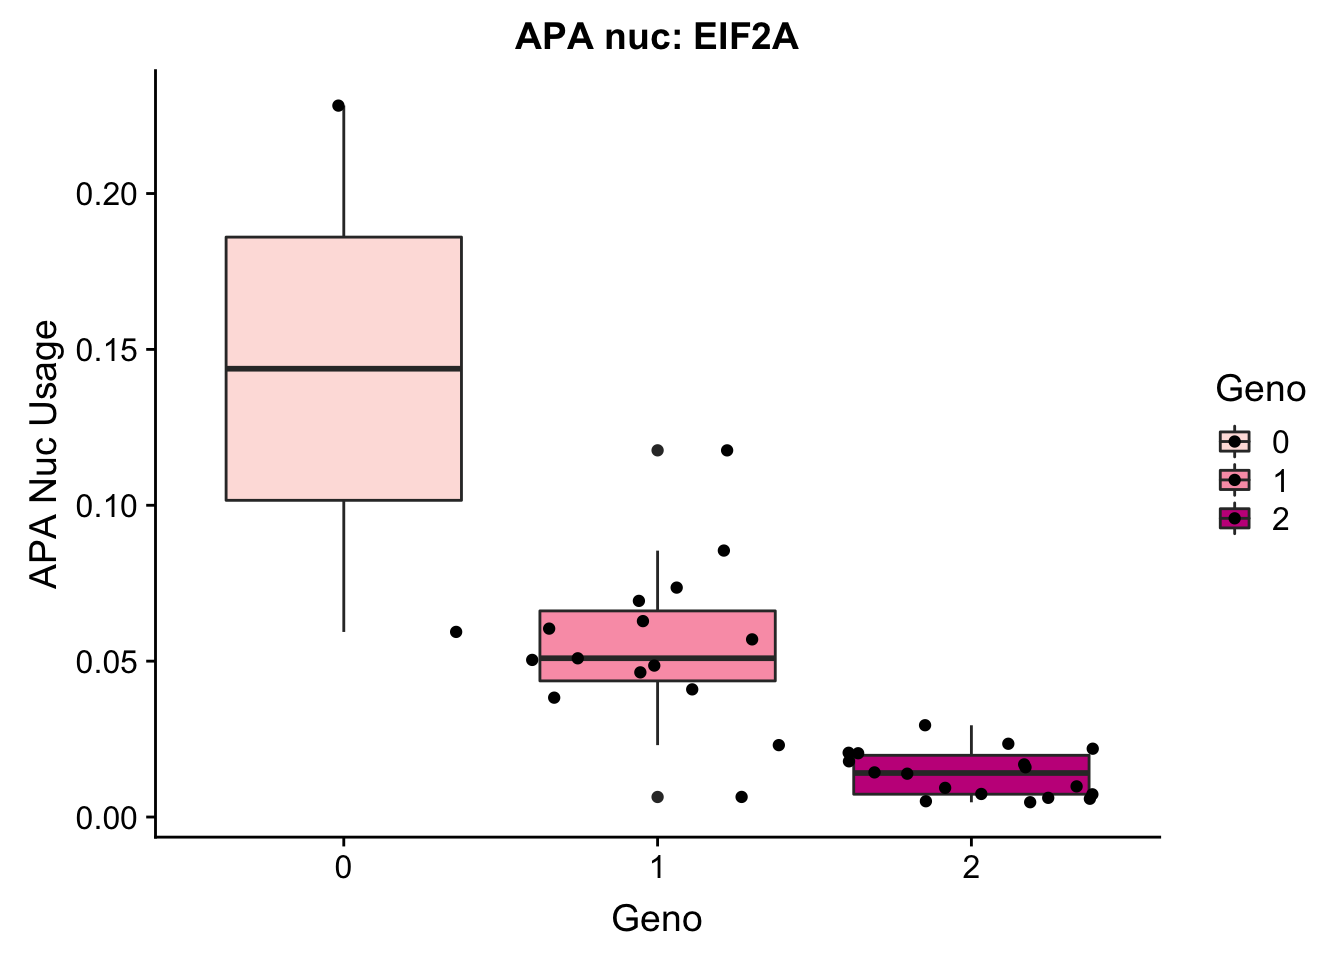
Expand here to see past versions of unnamed-chunk-12-1.png:
| Version | Author | Date |
|---|---|---|
| e73be70 | Briana Mittleman | 2018-10-09 |
This does the total and nuclear fraction of APA. I will do this for a snp and gene and get all of the other phenotypes. This will be similar other than changing the names of the genes and seperating the name for all but protein.
createQTLsnpMolPhenTable.py
def main(PhenFile, GenFile, outFile, snp, gene, molPhen):
    #genenames=open("/project2/gilad/briana/genome_anotation_data/ensemble_to_genename.txt", "r" )
    #for ln in genenames:
     #   geneName=ln.split()[1]
      #  if geneName == gene:
       #gene_ensg=ln.split()[0]
    gene_ensg=gene
    fout=open(outFile, "w")
    #Phen=open(PhenFile, "r")
    Gen=open(GenFile, "r")
    def getPheno(geneE=gene_ensg , mp=molPhen):
      pheno=open(PhenFile, "r")
      #get ind and pheno info
      mp_use=mp[1:-1]
      if mp_use=="prot":
        for num,ln in enumerate(pheno):
            if num == 0:
                indiv= ln.split()[4:]
            else:
                gene=ln.split()[3]
                if gene == str(geneE):
                    print("x")
                    pheno_list=ln.split()[4:]
                    pheno_data= list(zip(indiv, pheno_list))
                    return(pheno_data)
      else:
        for num,ln in enumerate(pheno):
            if num == 0:
                indiv= ln.split()[4:]
            else:
                full_gene=ln.split()[3]
                gene= full_gene.split(".")[0]
                if gene == geneE:
                    print(gene)
                    pheno_list=ln.split()[4:]
                    pheno_data= list(zip(indiv, pheno_list))
                    return(pheno_data)
    def getGeno(geno, SNP):
      for num, lnG in enumerate(geno):
          if num == 13:
              Ind_geno=lnG.split()[9:]
          if num >= 14:
              sid= lnG.split()[2]
              if sid == SNP:
                  gen_list=lnG.split()[9:]
                  allele1=[]
                  allele2=[]
                  for i in gen_list:
                      genotype=i.split(":")[0]
                      allele1.append(genotype.split("|")[0])
                      allele2.append(genotype.split("|")[1])
            #now i have my indiv., phen, allele 1, alle 2
                  geno_data=list(zip(Ind_geno, allele1, allele2))
                  return(geno_data)


    phenotype_data=getPheno()
    print(phenotype_data)
    pheno_df=pd.DataFrame(data=phenotype_data,columns=["Ind", "Pheno"])

    genotype_data=getGeno(Gen, snp)
    print(genotype_data)
    geno_df=pd.DataFrame(data=genotype_data, columns=["Ind", "Allele1", "Allele2"])

    full_df=pd.merge(geno_df, pheno_df, how="inner", on="Ind")
    full_df.to_csv(fout, sep="\t", encoding='utf-8', index=False)
    fout.close()


if __name__ == "__main__":
    import sys
    import pandas as pd
    chrom=sys.argv[1]
    snp = sys.argv[2]
    gene = sys.argv[3]
    molPhen=sys.argv[4]

    PhenFile = "/project2/gilad/briana/threeprimeseq/data/molecular_phenos/fastqtl_qqnorm%sphase2.fixed.noChr.txt"%(molPhen)
    GenFile= "/project2/gilad/briana/YRI_geno_hg19/chr%s.dose.filt.vcf"%(chrom)
    outFile = "/project2/gilad/briana/threeprimeseq/data/ApaQTL_examples/qtlSNP_Peak%s%s%s.txt"%(molPhen, snp, gene)
    main(PhenFile, GenFile, outFile, snp, gene,molPhen)
test this:
python createQTLsnpMolPhenTable.py 3 3:150302010 EIF2A _RNAseq_list for phenos:
4su_30
4su_60
RNAseqGeuvadis
RNAseq
prot
ribo
Create a bash script that will use a for loop to run the python script on a all of the phenotypes
run_createQTLsnpMolPhenTable.sh
#!/bin/bash

#SBATCH --job-name=run_createQTLsnpMolPhenTable
#SBATCH --account=pi-yangili1
#SBATCH --time=24:00:00
#SBATCH --output=run_createQTLsnpMolPhenTable.out
#SBATCH --error=run_createQTLsnpMolPhenTable.err
#SBATCH --partition=broadwl
#SBATCH --mem=12G
#SBATCH --mail-type=END

module load python


chrom=$1
snp=$2
gene=$3

for i in "_4su_30_" "_4su_60_" "_RNAseqGeuvadis_" "_RNAseq_" "_prot." "_ribo_"
do
python createQTLsnpMolPhenTable.py ${chrom} ${snp} ${gene} ${i}
done
Function to create plots:
I want to imput the files with the following structure:
/Users/bmittleman1/Documents/Gilad_lab/threeprimeseq/data/apaExamp/qtlSNP_Peakmolpheno.snp.peak/gene.txt
I will use these to make cowplot with ggplot boxplots for each phenotypes. To do this I will create a function that takes in a snp, peak, and gene and creates each phenotype plot. It will then return the cowplot plot grid.
plotQTL_func= function(SNP, peak, gene){
  apaN_file=read.table(paste("../data/apaExamp/qtlSNP_PeakAPANuclear.", SNP, peak, ".txt", sep = "" ), header=T)
  apaT_file=read.table(paste("../data/apaExamp/qtlSNP_PeakAPATotal.", SNP, peak, ".txt", sep = "" ), header=T)
  su30_file=read.table(paste("../data/apaExamp/qtlSNP_Peak_4su_30_", SNP, gene, ".txt", sep=""), header = T)
  su60_file=read.table(paste("../data/apaExamp/qtlSNP_Peak_4su_60_", SNP, gene, ".txt", sep=""), header=T)
  RNA_file=read.table(paste("../data/apaExamp/qtlSNP_Peak_RNAseq_", SNP, gene, ".txt", sep=""),header=T)
  RNAg_file=read.table(paste("../data/apaExamp/qtlSNP_Peak_RNAseqGeuvadis_", SNP, gene, ".txt", sep=""), header = T)
  ribo_file=read.table(paste("../data/apaExamp/qtlSNP_Peak_ribo_", SNP, gene, ".txt", sep=""),header=T)
  prot_file=read.table(paste("../data/apaExamp/qtlSNP_Peak_prot.", SNP, gene, ".txt", sep=""), header=T)

  ggplot_func= function(file, molPhen,GENE){
    file = file %>% mutate(genotype=Allele1 + Allele2)
    file$genotype= as.factor(as.character(file$genotype))
    plot=ggplot(file, aes(y=Pheno, x=genotype, by=genotype, fill=genotype)) + geom_boxplot(width=.25) + geom_jitter() + labs(y="Phenotpye",title=paste(molPhen, GENE, sep=": ")) + scale_fill_brewer(palette="Paired")
    return(plot)
  }

  apaNplot=ggplot_func(apaN_file, "Apa Nuclear", gene)
  apaTplot=ggplot_func(apaT_file, "Apa Total", gene)
  su30plot=ggplot_func(su30_file, "4su30",gene)
  su60plot=ggplot_func(su60_file, "4su60",gene)
  RNAplot=ggplot_func(RNA_file, "RNA Seq",gene)
  RNAgPlot=ggplot_func(RNAg_file, "RNA Seq Geuvadis",gene)
  riboPlot= ggplot_func(ribo_file, "Ribo Seq",gene)
  protplot=ggplot_func(prot_file, "Protein",gene)

  full_plot= plot_grid(apaNplot,apaTplot, su30plot, su60plot, RNAplot, RNAgPlot, riboPlot, protplot,nrow=2)
  return (full_plot)
}
Try this with the EIF2A QTL:
eif2a_allplots=plotQTL_func(SNP="3:150302010", peak="peak228606", gene="EIF2A")

ggsave("../output/plots/EIF2A_allplots.png", eif2a_allplots, height=5, width=12)
Try with another snp:
- peak164036, sid: 2:3502035
Step 1: Figure out what gene the peak is in.
grep peak164036 /project2/gilad/briana/threeprimeseq/data/perm_APAqtl_trans/filtered_APApeaks_merged_allchrom_refseqGenes_pheno_Nuclear_transcript_permResBH.txtThis peak is in ADI1
Step2: Get the total and nuclear APA values by genotype with createQTLsnpAPAPhenTable.py
python createQTLsnpAPAPhenTable.py 2 2:3502035 peak164036 Total

python createQTLsnpAPAPhenTable.py 2 2:3502035 peak164036 Nuclear
Step 3: Get the ensg gene name:
grep ADI1 /project2/gilad/briana/genome_anotation_data/ensemble_to_genename.txtStep 4: Run this on the other phenotypes with : run_createQTLsnpMolPhenTable.sh
sbatch run_createQTLsnpMolPhenTable.sh "2" "2:3502035" "ENSG00000182551"
Step 4: copy files to computer:
scp brimittleman@midway2.rcc.uchicago.edu:/project2/gilad/briana/threeprimeseq/data/ApaQTL_examples/qtlSNP_Peak*2:* . Step 5: plot
plotQTL_func(SNP="2:3502035", peak="peak164036", gene="ENSG00000182551")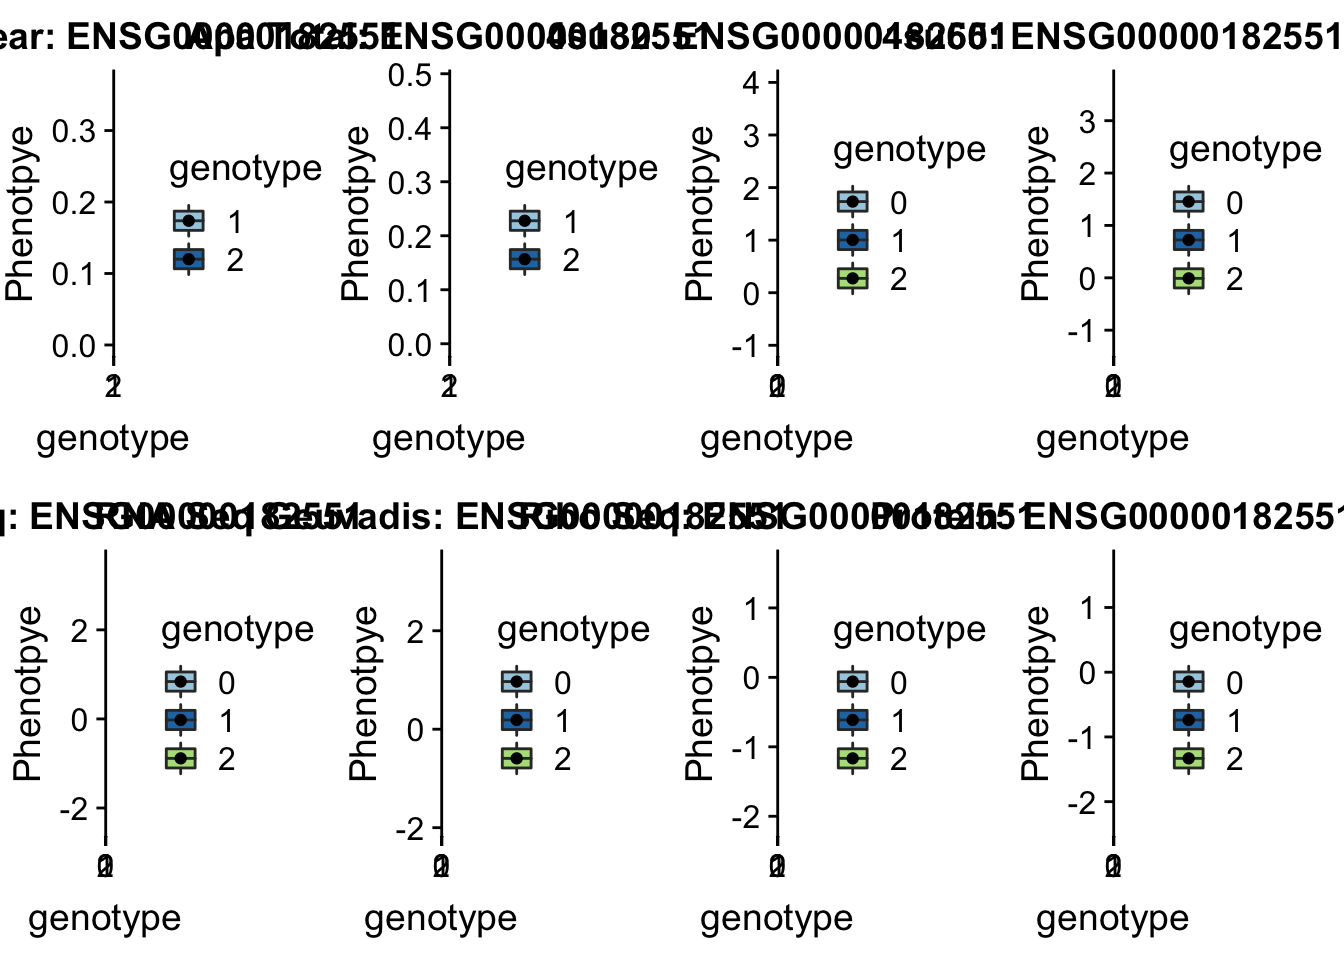
Expand here to see past versions of unnamed-chunk-23-1.png:
| Version | Author | Date |
|---|---|---|
| 8211a07 | Briana Mittleman | 2018-10-11 |
- peak305794, sid: 7:128635754
grep peak305794 /project2/gilad/briana/threeprimeseq/data/perm_APAqtl_trans/filtered_APApeaks_merged_allchrom_refseqGenes_pheno_Nuclear_transcript_permResBH.txt
#gene=IRF5
grep IRF5 /project2/gilad/briana/genome_anotation_data/ensemble_to_genename.txt
#ensg= ENSG00000128604

python createQTLsnpAPAPhenTable.py 7 7:128635754  peak305794 Total
python createQTLsnpAPAPhenTable.py 7 7:128635754  peak305794 Nuclear


sbatch run_createQTLsnpMolPhenTable.sh "7" "7:128635754" "ENSG00000128604"

scp brimittleman@midway2.rcc.uchicago.edu:/project2/gilad/briana/threeprimeseq/data/ApaQTL_examples/qtlSNP_Peak_*7:* .
scp brimittleman@midway2.rcc.uchicago.edu:/project2/gilad/briana/threeprimeseq/data/ApaQTL_examples/qtlSNP_PeakAPA*.7* .
plotQTL_func(SNP="7:128635754", peak="peak305794", gene="ENSG00000128604")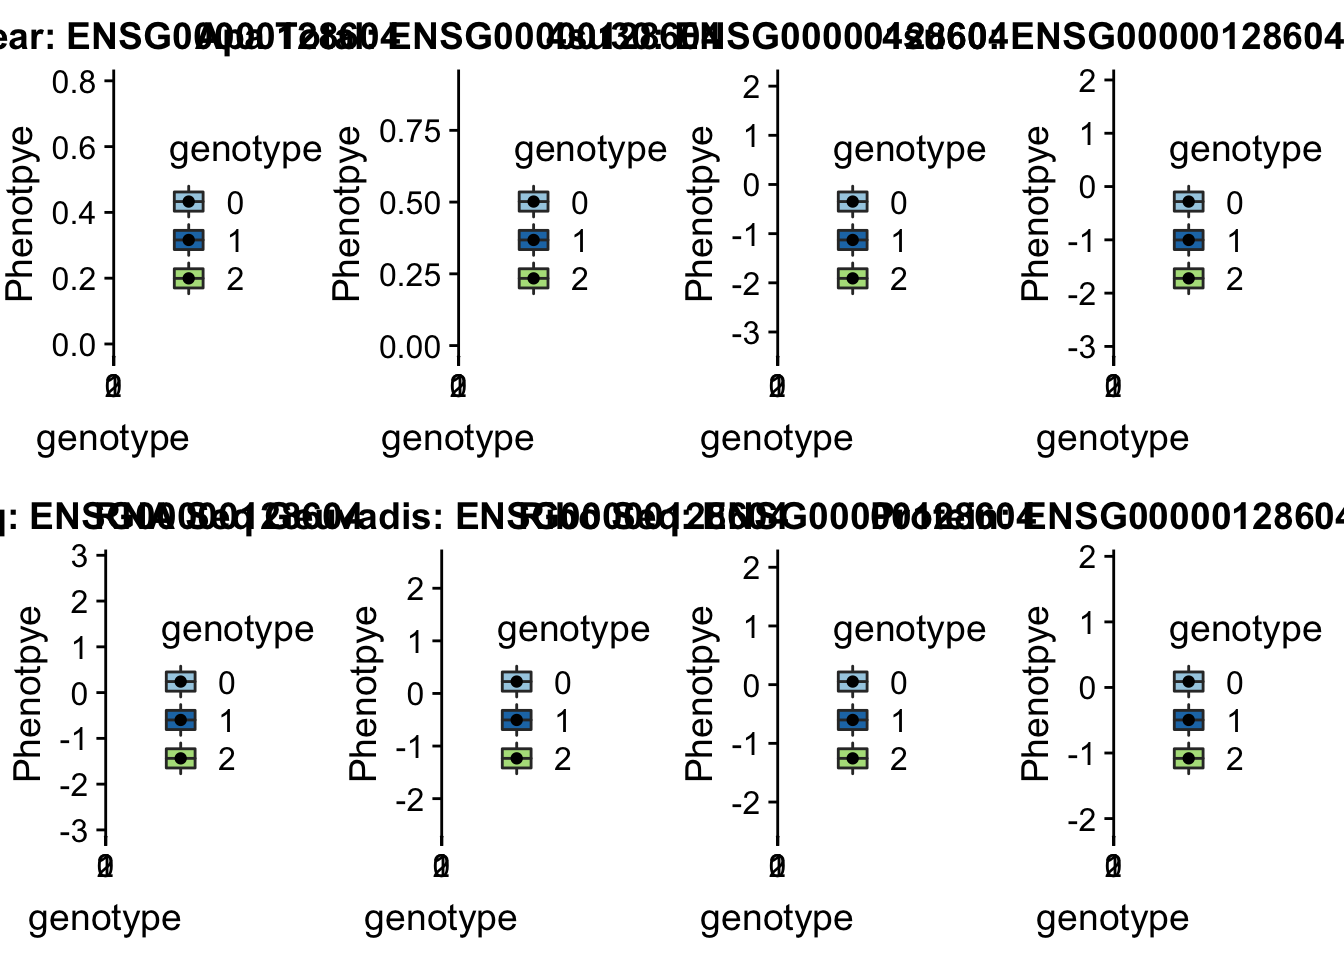
Expand here to see past versions of unnamed-chunk-25-1.png:
| Version | Author | Date |
|---|---|---|
| 8211a07 | Briana Mittleman | 2018-10-11 |
- Peak: peak152751, SID 19:4236475
grep peak152751 /project2/gilad/briana/threeprimeseq/data/perm_APAqtl_trans/filtered_APApeaks_merged_allchrom_refseqGenes_pheno_Nuclear_transcript_permResBH.txt
#gene=EBI3
grep EBI3 /project2/gilad/briana/genome_anotation_data/ensemble_to_genename.txt
#ensg= ENSG00000105246

python createQTLsnpAPAPhenTable.py 19 19:4236475  peak152751 Total
python createQTLsnpAPAPhenTable.py 19 19:4236475  peak152751 Nuclear


sbatch run_createQTLsnpMolPhenTable.sh "19" "19:4236475 " "ENSG00000105246"

scp brimittleman@midway2.rcc.uchicago.edu:/project2/gilad/briana/threeprimeseq/data/ApaQTL_examples/*19:4236475* .
plotQTL_func(SNP="19:4236475", peak="peak152751", gene="ENSG00000105246")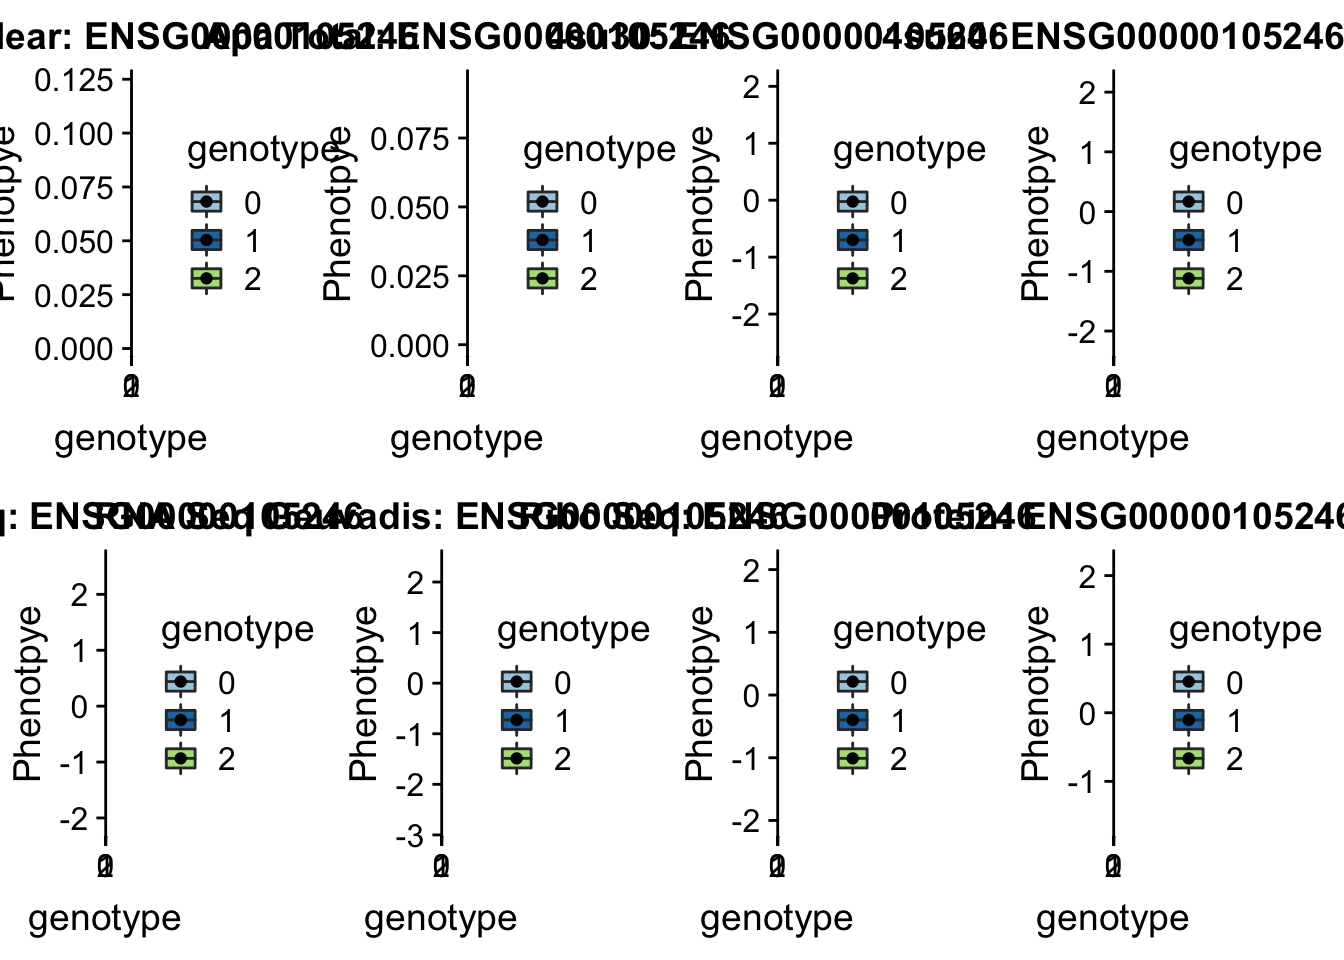
Expand here to see past versions of unnamed-chunk-27-1.png:
| Version | Author | Date |
|---|---|---|
| 8211a07 | Briana Mittleman | 2018-10-11 |
- 4:84382181:84382182:MRPS18C_+_peak241853, snp4:84382264
#gene=MRPS18C
grep MRPS18C /project2/gilad/briana/genome_anotation_data/ensemble_to_genename.txt
#ensg= ENSG00000163319

python createQTLsnpAPAPhenTable.py 4 4:84382264  peak241853 Total
python createQTLsnpAPAPhenTable.py 4 4:84382264  peak241853 Nuclear


sbatch run_createQTLsnpMolPhenTable.sh "4" "4:84382264 " "ENSG00000163319"

scp brimittleman@midway2.rcc.uchicago.edu:/project2/gilad/briana/threeprimeseq/data/ApaQTL_examples/*4:84382264* .
We dont have protein information for this gene
plotQTL_func(SNP="4:84382264", peak="peak241853", gene="ENSG00000163319")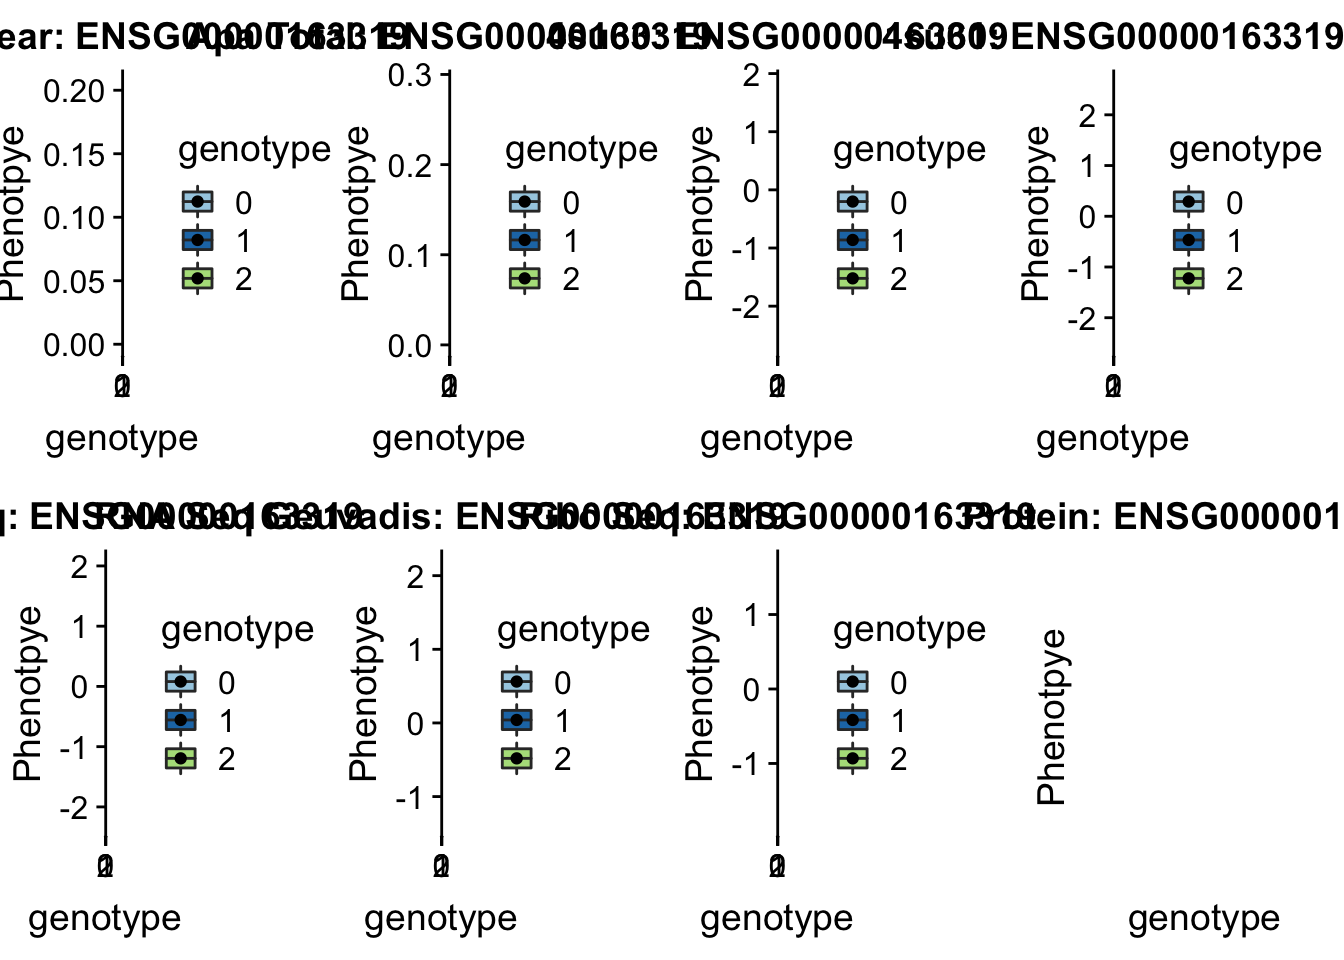
Expand here to see past versions of unnamed-chunk-29-1.png:
| Version | Author | Date |
|---|---|---|
| 8211a07 | Briana Mittleman | 2018-10-11 |
- 7:66703515:66703516:TYW1_+_peak298097 7:66595366
#gene=TYW1
grep TYW1 /project2/gilad/briana/genome_anotation_data/ensemble_to_genename.txt
#ensg= ENSG00000198874

python createQTLsnpAPAPhenTable.py 7 7:66595366 peak298097 Total
python createQTLsnpAPAPhenTable.py 7 7:66595366  peak298097 Nuclear


sbatch run_createQTLsnpMolPhenTable.sh "7" "7:66595366" "ENSG00000198874"

scp brimittleman@midway2.rcc.uchicago.edu:/project2/gilad/briana/threeprimeseq/data/ApaQTL_examples/*7:66595366* .
plotQTL_func(SNP="7:66595366", peak="peak298097", gene="ENSG00000198874")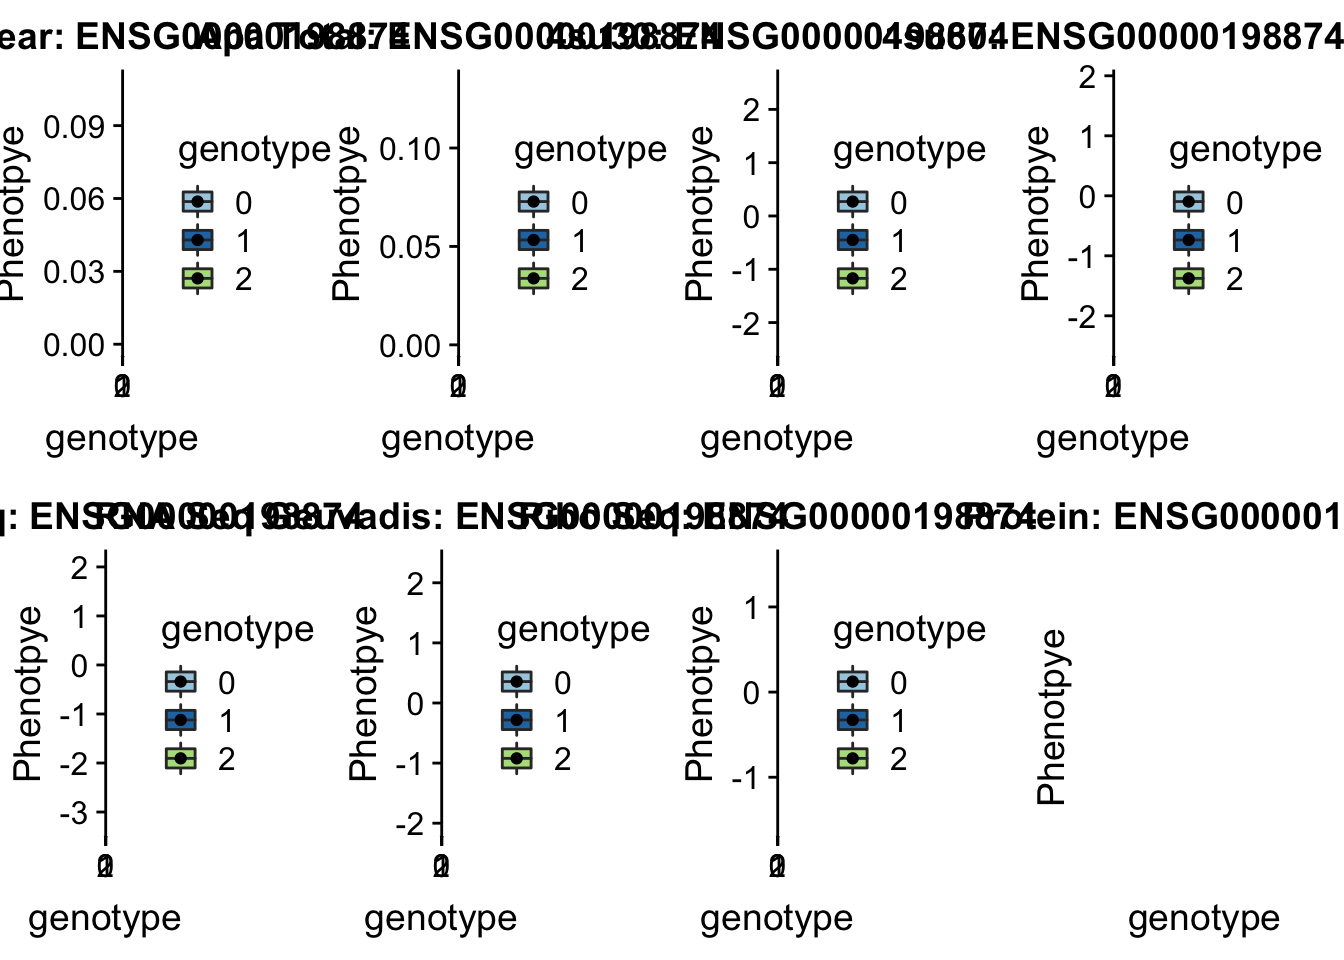
- 8:2792874:2792875:CSMD1_-_peak310334 8:3037787
#gene=CSMD1
grep CSMD1 /project2/gilad/briana/genome_anotation_data/ensemble_to_genename.txt
#ensg= ENSG00000183117

python createQTLsnpAPAPhenTable.py 8 8:3037787   peak310334 Total
python createQTLsnpAPAPhenTable.py 8 8:3037787    peak310334 Nuclear


sbatch run_createQTLsnpMolPhenTable.sh "8" "8:3037787" "ENSG00000183117"

scp brimittleman@midway2.rcc.uchicago.edu:/project2/gilad/briana/threeprimeseq/data/ApaQTL_examples/*8:3037787* .
We do not have molecular phenotypes for this gene.
- 6:11183530:11183531:NEDD9_-_peak272002 6:11212754
#gene=NEDD9
grep NEDD9 /project2/gilad/briana/genome_anotation_data/ensemble_to_genename.txt
#ensg= ENSG00000111859

python createQTLsnpAPAPhenTable.py 6 6:11212754  peak272002 Total
python createQTLsnpAPAPhenTable.py 6 6:11212754  peak272002 Nuclear


sbatch run_createQTLsnpMolPhenTable.sh "6" "6:11212754" "ENSG00000111859"

scp brimittleman@midway2.rcc.uchicago.edu:/project2/gilad/briana/threeprimeseq/data/ApaQTL_examples/*6:11212754* .
plotQTL_func(SNP="6:11212754", peak="peak272002", gene="ENSG00000111859")Warning: Removed 9 rows containing non-finite values (stat_boxplot).Warning: Removed 9 rows containing missing values (geom_point).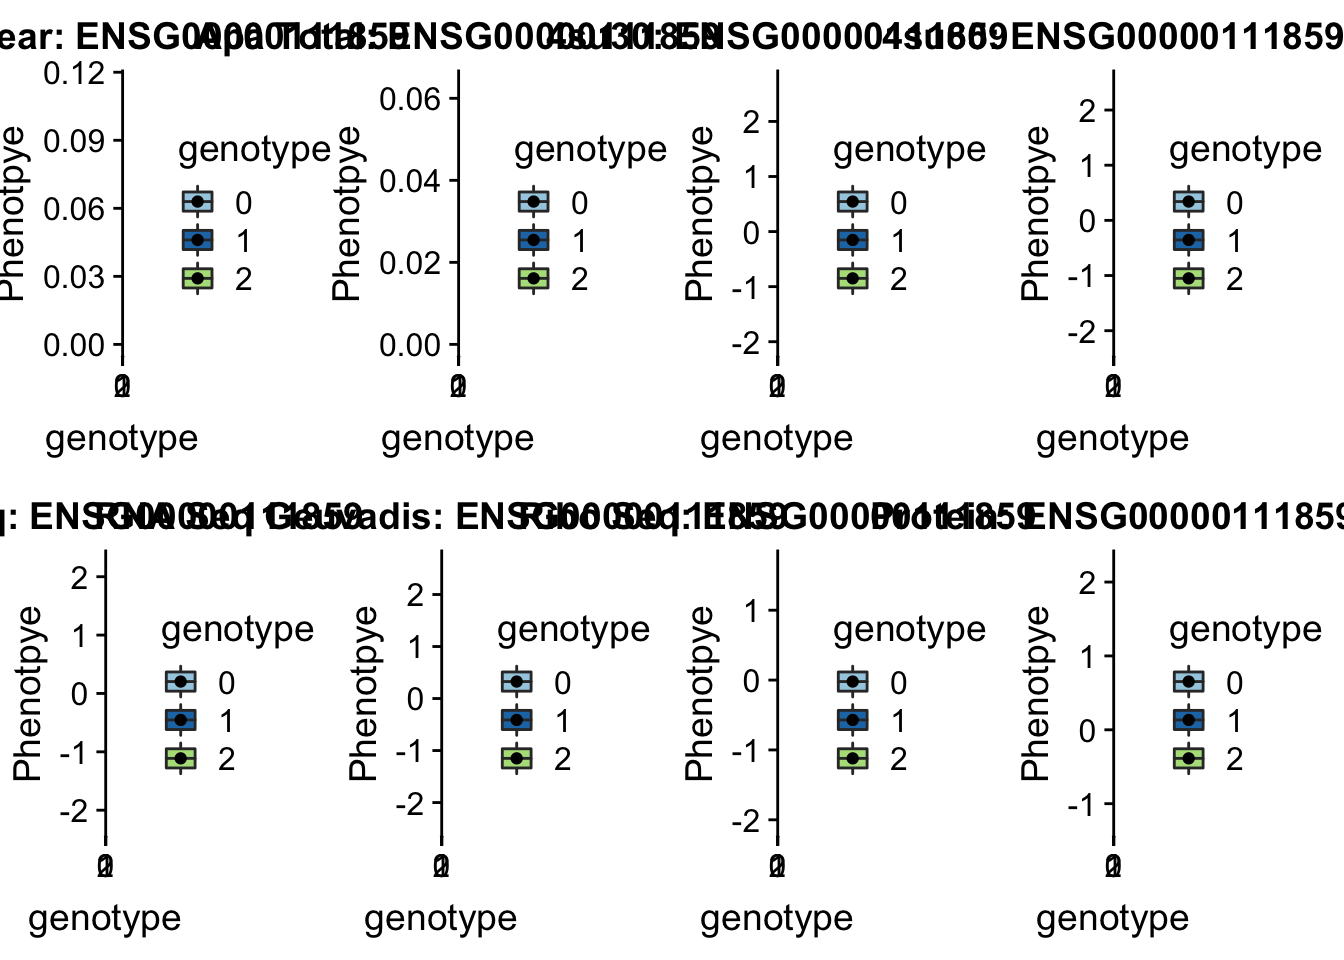
- 12:51453213:51453214:LETMD1_+_peak71110 12:51405335
#gene=LETMD1
grep LETMD1 /project2/gilad/briana/genome_anotation_data/ensemble_to_genename.txt
#ensg= ENSG00000050426

python createQTLsnpAPAPhenTable.py 12 12:51405335  peak71110 Total
python createQTLsnpAPAPhenTable.py 12 12:51405335  peak71110 Nuclear


sbatch run_createQTLsnpMolPhenTable.sh "12" "12:51405335" "ENSG00000050426"

scp brimittleman@midway2.rcc.uchicago.edu:/project2/gilad/briana/threeprimeseq/data/ApaQTL_examples/*12:51405335* .
plotQTL_func(SNP="12:51405335", peak="peak71110", gene="ENSG00000050426")Warning: Removed 7 rows containing non-finite values (stat_boxplot).Warning: Removed 7 rows containing missing values (geom_point).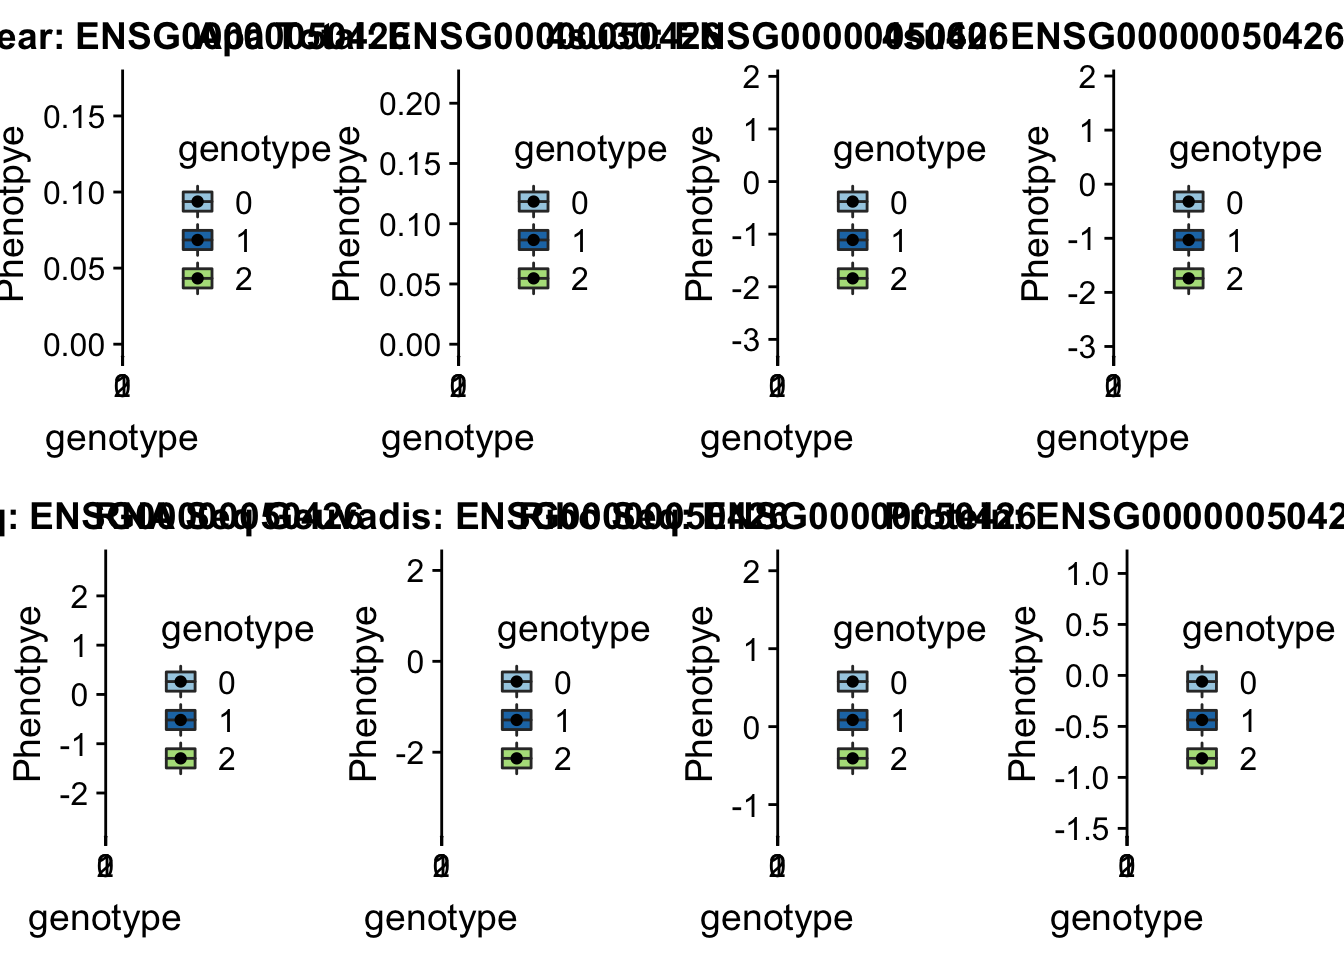
Session information
sessionInfo()R version 3.5.1 (2018-07-02)
Platform: x86_64-apple-darwin15.6.0 (64-bit)
Running under: macOS Sierra 10.12.6
Matrix products: default
BLAS: /Library/Frameworks/R.framework/Versions/3.5/Resources/lib/libRblas.0.dylib
LAPACK: /Library/Frameworks/R.framework/Versions/3.5/Resources/lib/libRlapack.dylib
locale:
[1] en_US.UTF-8/en_US.UTF-8/en_US.UTF-8/C/en_US.UTF-8/en_US.UTF-8
attached base packages:
[1] grid stats graphics grDevices utils datasets methods
[8] base
other attached packages:
[1] bindrcpp_0.2.2 cowplot_0.9.3 data.table_1.11.8
[4] VennDiagram_1.6.20 futile.logger_1.4.3 forcats_0.3.0
[7] stringr_1.3.1 dplyr_0.7.6 purrr_0.2.5
[10] readr_1.1.1 tidyr_0.8.1 tibble_1.4.2
[13] ggplot2_3.0.0 tidyverse_1.2.1 reshape2_1.4.3
[16] workflowr_1.1.1
loaded via a namespace (and not attached):
[1] tidyselect_0.2.4 haven_1.1.2 lattice_0.20-35
[4] colorspace_1.3-2 htmltools_0.3.6 yaml_2.2.0
[7] rlang_0.2.2 R.oo_1.22.0 pillar_1.3.0
[10] glue_1.3.0 withr_2.1.2 R.utils_2.7.0
[13] RColorBrewer_1.1-2 lambda.r_1.2.3 modelr_0.1.2
[16] readxl_1.1.0 bindr_0.1.1 plyr_1.8.4
[19] munsell_0.5.0 gtable_0.2.0 cellranger_1.1.0
[22] rvest_0.3.2 R.methodsS3_1.7.1 evaluate_0.11
[25] labeling_0.3 knitr_1.20 broom_0.5.0
[28] Rcpp_0.12.19 formatR_1.5 backports_1.1.2
[31] scales_1.0.0 jsonlite_1.5 hms_0.4.2
[34] digest_0.6.17 stringi_1.2.4 rprojroot_1.3-2
[37] cli_1.0.1 tools_3.5.1 magrittr_1.5
[40] lazyeval_0.2.1 futile.options_1.0.1 crayon_1.3.4
[43] whisker_0.3-2 pkgconfig_2.0.2 xml2_1.2.0
[46] lubridate_1.7.4 assertthat_0.2.0 rmarkdown_1.10
[49] httr_1.3.1 rstudioapi_0.8 R6_2.3.0
[52] nlme_3.1-137 git2r_0.23.0 compiler_3.5.1
This reproducible R Markdown analysis was created with workflowr 1.1.1